• Skip to primary navigation
  • Skip to main content
  • Skip to primary sidebar
Analytics Course

Analytics Course

Learn Google Analytics Like an Expert

  • Home
  • Buy Analytics Course
  • Reviews
  • Blog

Google Analytics Blog from Jeffalytics

How to Create a Custom Channel Grouping in Google Analytics

February 7, 2018 by Jeff Sauer 3 Comments

One of the biggest questions marketers have when looking at analytics data is “how do people find my website?”

Google Analytics tells us this information quite easily inside of their acquisition reports. In fact, if you look in your Google Analytics account right now, you can see how your visitors navigate to your website. Google has neatly organized your web traffic using something called channel grouping.

Channels represent the paths visitors take to arrive on your website. Some visitors type in your URL, some search your brand name, others search by topic and find your content.

By default, Google groups everything into channels, and shows you how your traffic comes in for each channel. But there are some problems with the default channel groupings in Google Analytics. The default channels are extremely broad. They over-simplify the traffic coming to your website.

These broad categories don’t allow you to learn much about your website traffic. But don’t worry. We are going to fix this problem….

Let’s create custom channel groupings in Google Analytics!!

That’s right. Today we are going to learn one of the most effective techniques for analyzing your website traffic!

In this post and video, we’ll take a deep-dive into channel groupings. We’ll learn how we can create custom channels to improve our web analytics, and talk about the best strategies for building custom channel groupings. I’ll also show you exactly how I set up my channel grouping, and how you can easily improve upon the defaults.

Channel groupings in Google Analytics

Channel Grouping In Google Analytics

Before we get into creating some kick-butt custom channel groupings…

Let’s talk about the default channels.

It’s important to understand what makes up the default channels, and how these channels represent our web traffic. Once you know how default channels work, you can start making more awesome custom channels!

Default channel grouping in Google Analytics

The default channels in Google Analytics include:

  • Organic Search
  • Paid Search
  • Direct
  • Social
  • Email 
  • Referral
  • Display

These defaults are derived from the source and medium attached to your traffic sources.

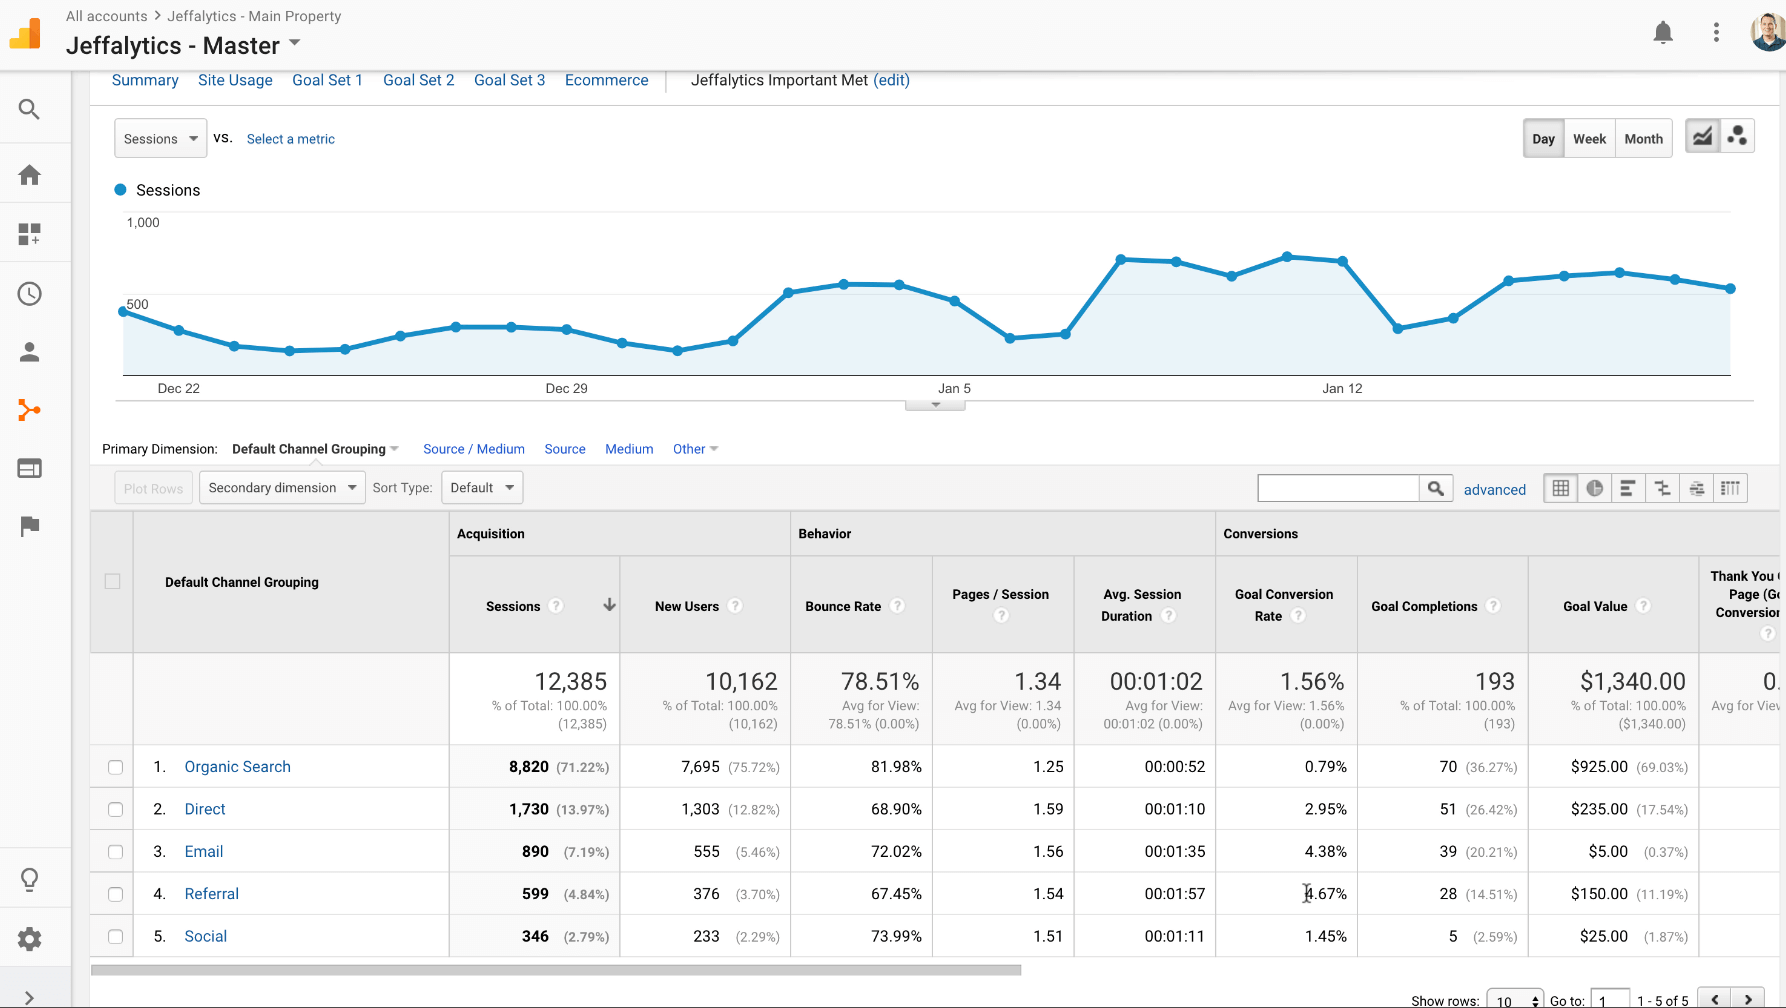
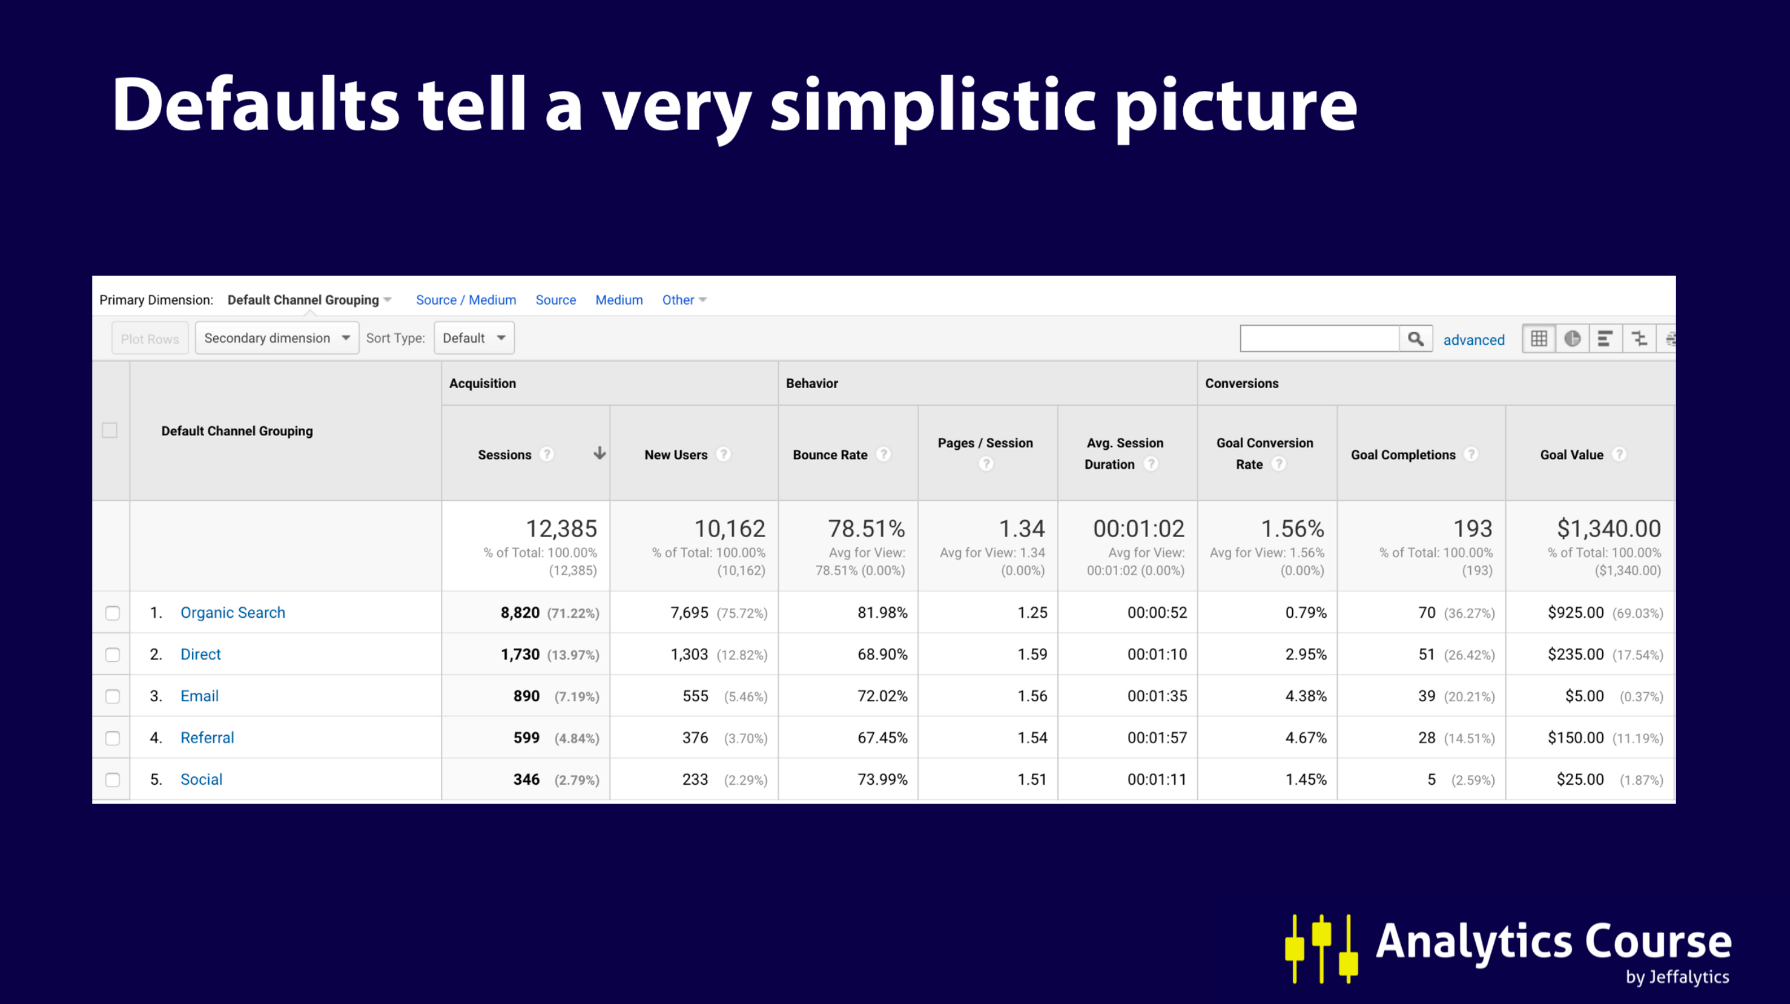
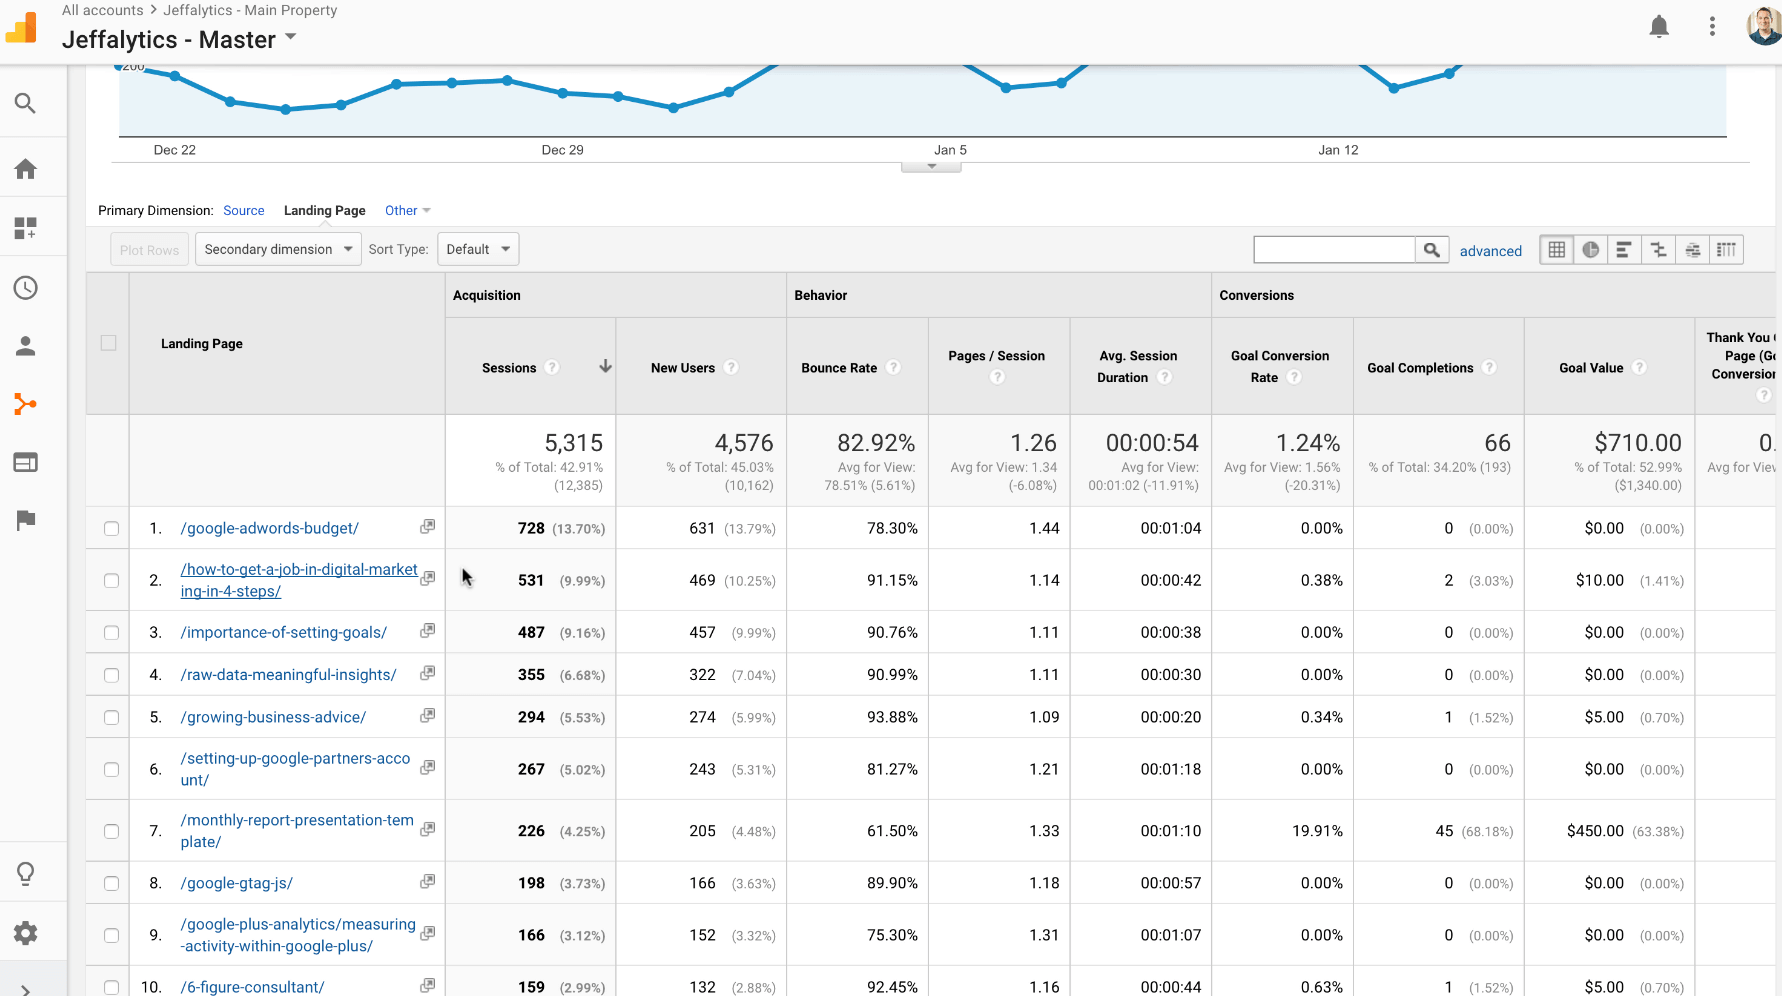
Here’s an example of what these default channel groupings look like for jeffalytics.com.
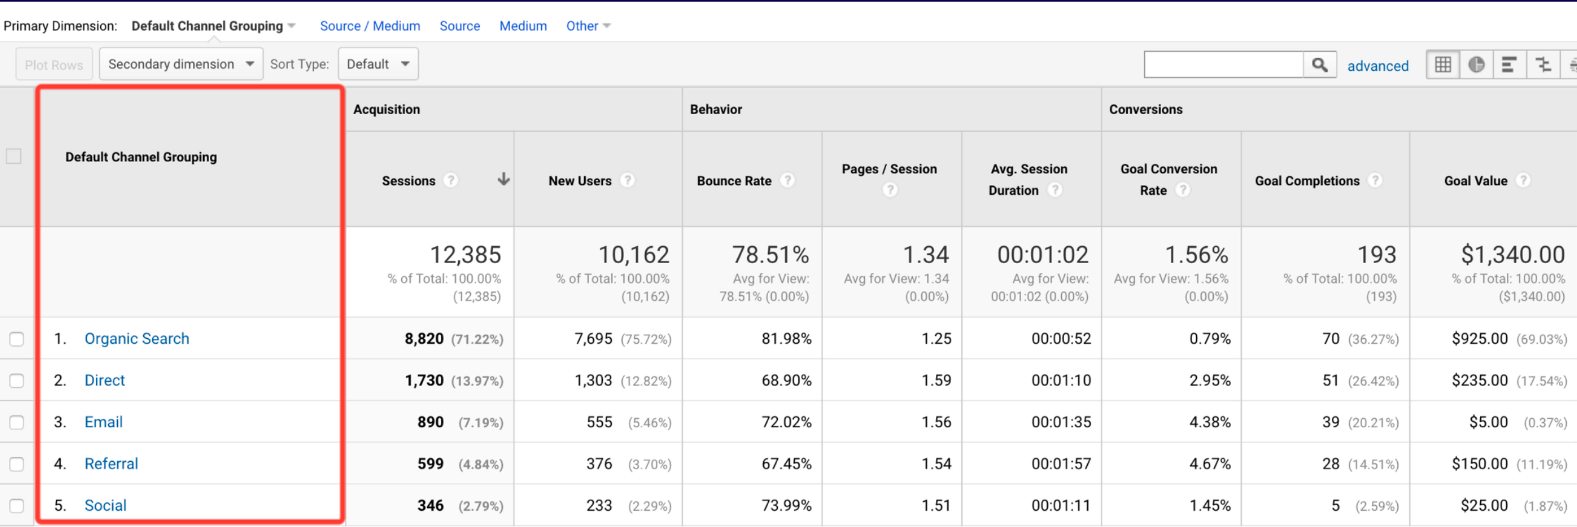
channel grouping in google analytics

Organic Search

Organic search is traffic that found your website using a search engine. This group includes every search that was used to find your website.

These searches could be related to your brand, your content, or your products. For many websites, organic search dominates traffic numbers.

You can see from my example below, that organic search accounts for over 70% of the traffic going to Jeffalytics. This very broad category tends to limit our ability to learn more about our search traffic. We’ll look at how to fix this problem later in this post.

default channel grouping in google analytics

Direct

Direct traffic accounts for site visitors that arrived directly to your website without a referrer string. These visitors typed your URL into their browser and went right to your site.

I often refer to this channel as “The Darkness.” It’s hard to learn anything about where these visitors came from our why they used our URL. Since I can’t learn anything from this channel, it’s like the black hole of my channel grouping.

Social

The social channel is any traffic that came to your website from a social media source, as defined by Google.

Email

This channel is set up to account for the traffic that clicks through to your site from links in your email. Keep in mind that you have to use UTM parameters in your email links for Google to track this traffic. If you’re not using UTM parameters, Google won’t be able to sort you email traffic into this channel.
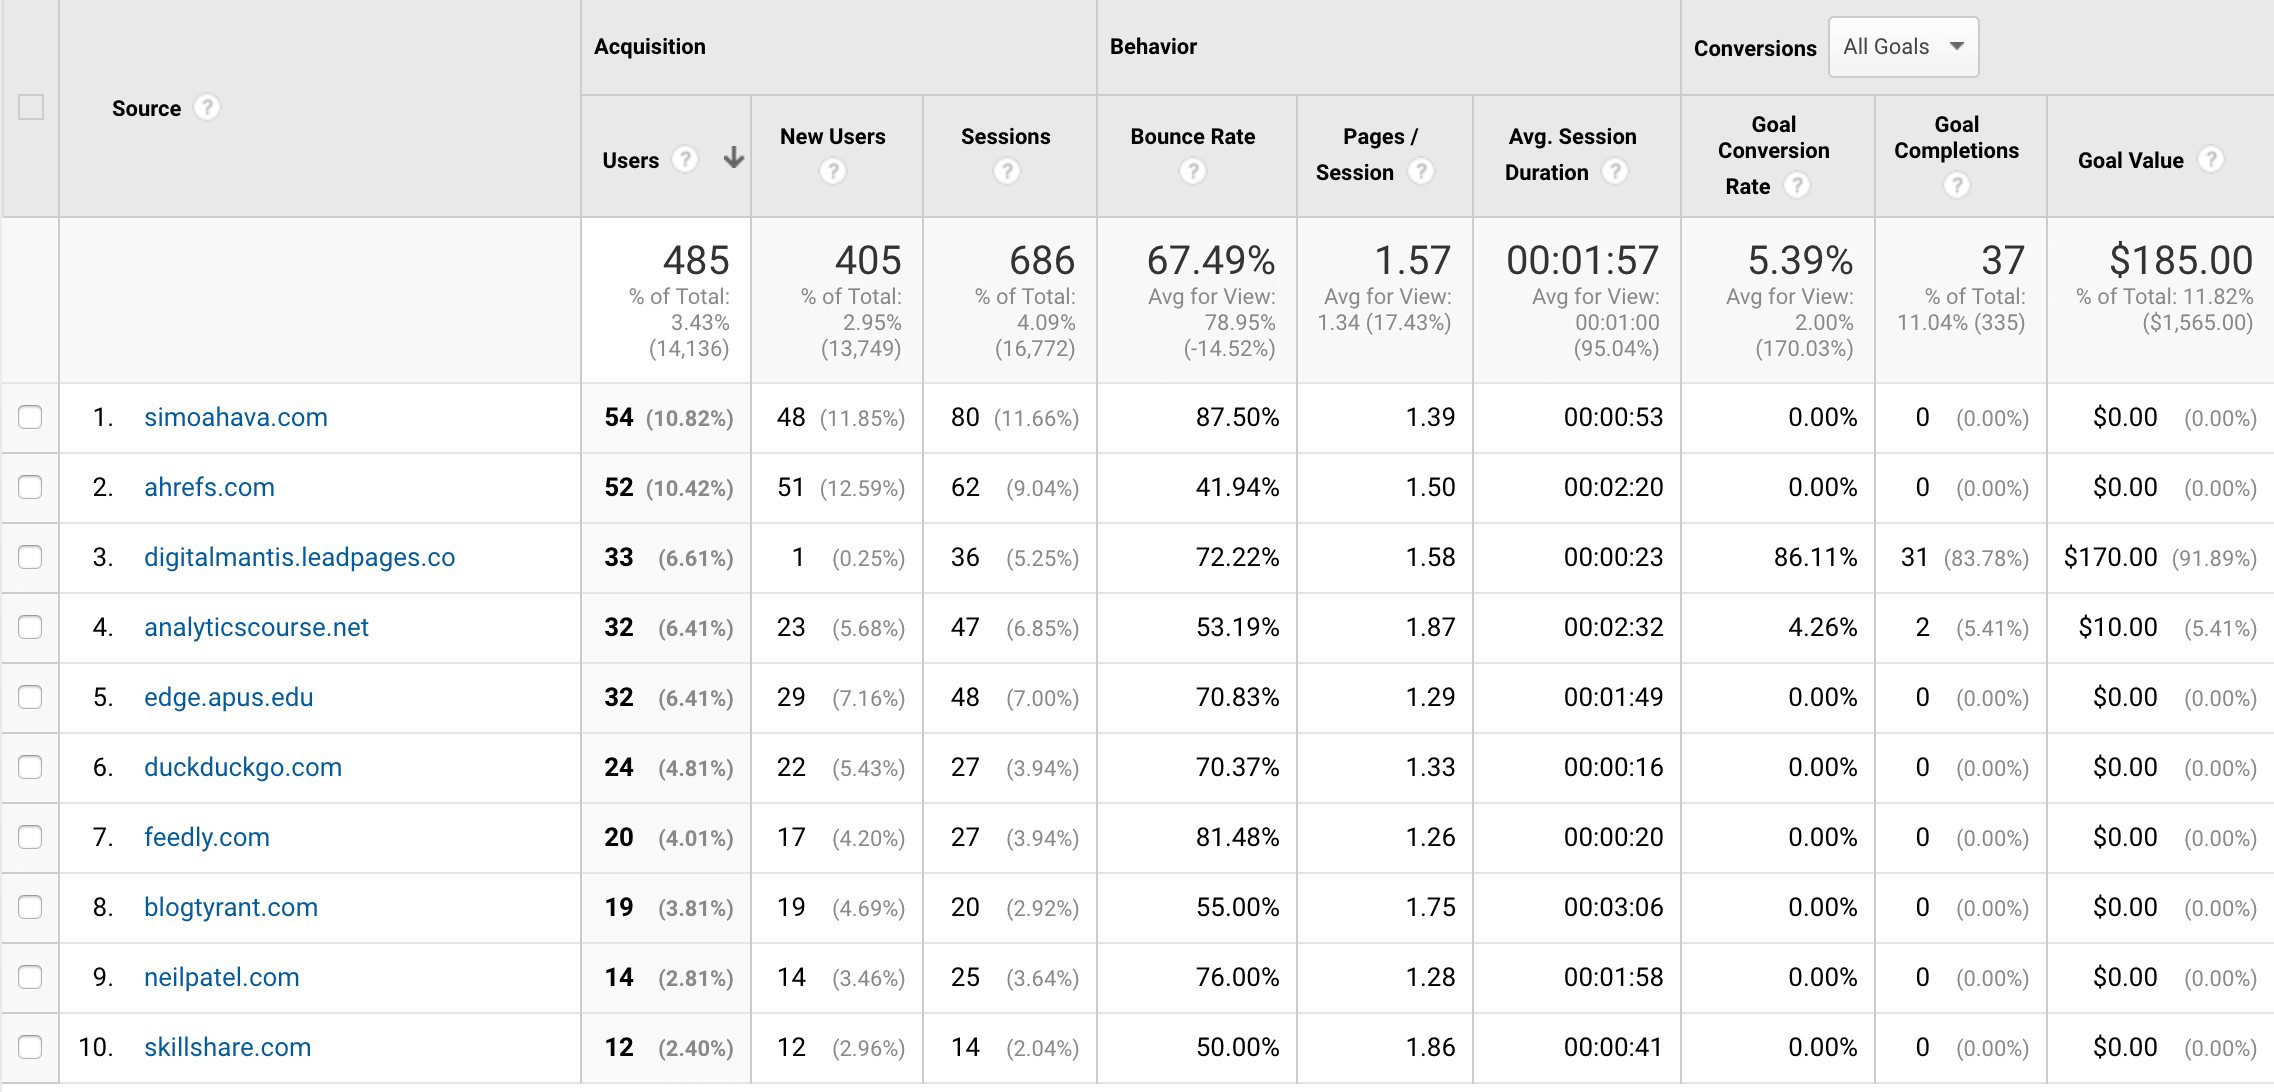
Referral

Referral traffic is traffic that was sent to your site from a link on another site. Clicking on your referral channel in your analytics account will allow you to see the referrals that are sending you traffic. Below is an example of where my referral traffic is coming from.

referral channel grouping

What’s wrong with the default channel grouping in Google Analytics?

Fair warning, I am about to go on a bit of rant here. [If you want to hear my full rant, watch the video above].

The default channel grouping in Google Analytics is very well thought out. The channels account for just about every traffic source on the web.

But, not all websites are the same. The defaults are one-size-fits-all. They are generic, and at times uninspired. The default settings don’t take into account the language you use to describe your website marketing efforts.

The  generic channel categories limit what we can learn about our website visitors. They also don’t allow us to see how our marketing efforts are really working!

default channel grouping in google analytics

Let’s look at this problem as it relates to the organic search channel.

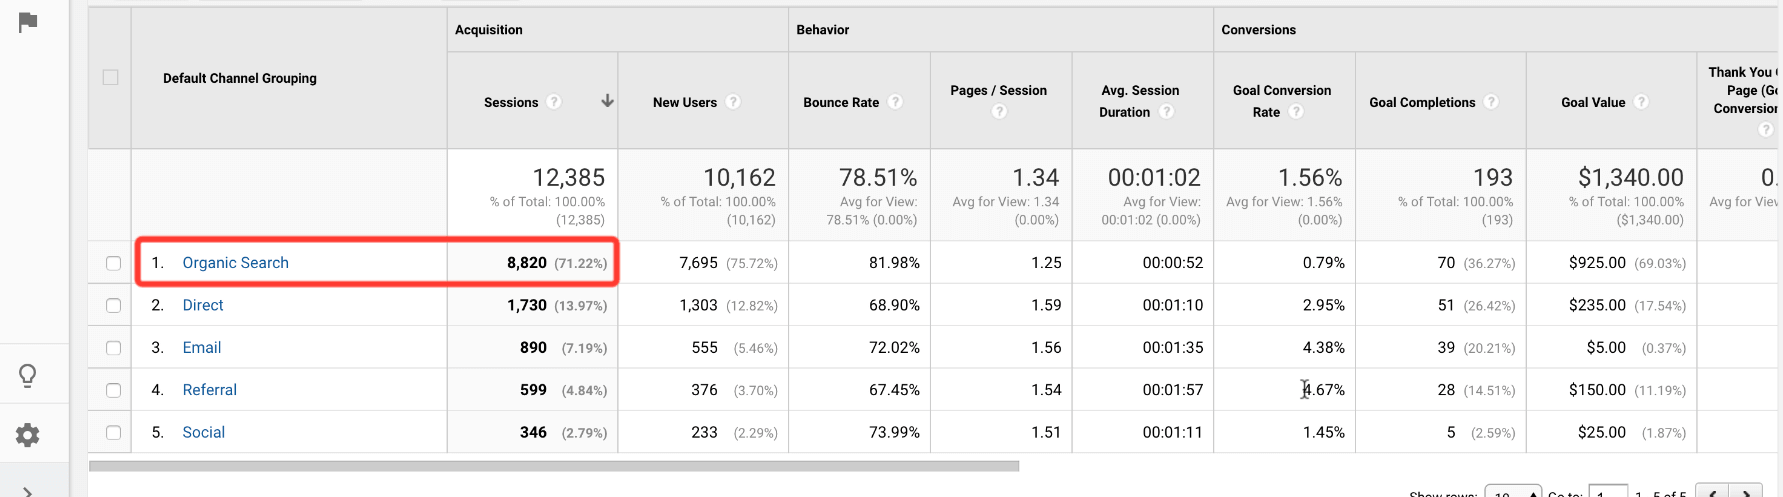
Organic search channel problems

We’ll use my data as the example again.  As you can see, I can’t infer much from my channel report. 70% of my traffic is categorized as organic search.  Organic search is such a big category that I can’t do any meaningful analysis of my traffic.

The visitors in this category could have searched my name. Or they could have searched for content about Google Analytics and found my site. Or maybe they searched a PPC topic and landed on one of my blog posts.

Without breaking this channel down further, I have no direction as to why most people land on Jeffalytics from search engines.

organic search channel google analytics

If I just trust the Google Analytics default settings to give me information, I wont know anything about my web traffic. I won’t learn what my visitors are looking for, or how I can make my content better.

Don’t trust default settings to give you insights!

Google Analytics may be the most powerful marketing tool on the planet – But if you don’t customize it to your needs, you are using about 1/10th of its capability.

Default channel grouping in google analytics

So, let’s learn how to customize our channel grouping so we can see what’s really going on with our website.

Analytics Course student question

This post was inspired by a question from one of our Analytics Course students, Fred.

Fred asks:

Analytics Course question

Let’s answer Fred’s questions and take a look at my custom channel grouping in Google Analytics! Showing you how I setup my channel grouping will help you learn how to customize your own channels.

Custom channel grouping in Google Analytics

By clicking the primary dimension dropdown, I can navigate to my Jeffalytics Content Grouping channels.

Custom channel grouping in google analytics

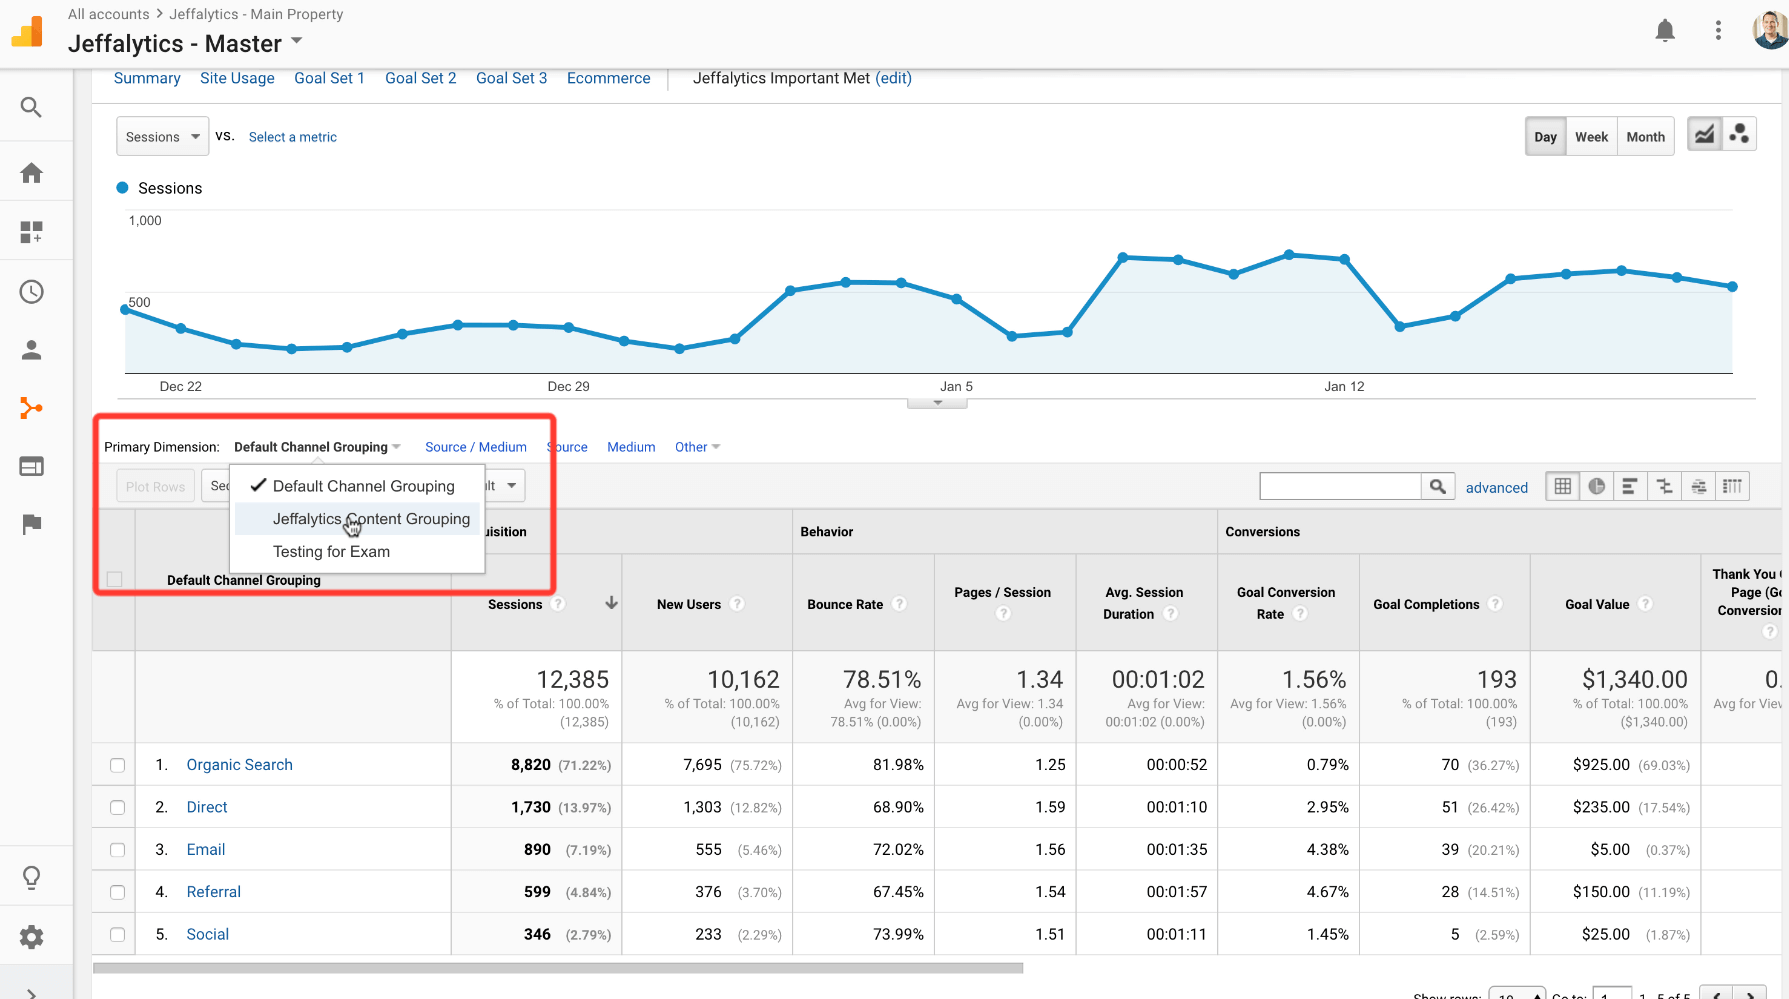
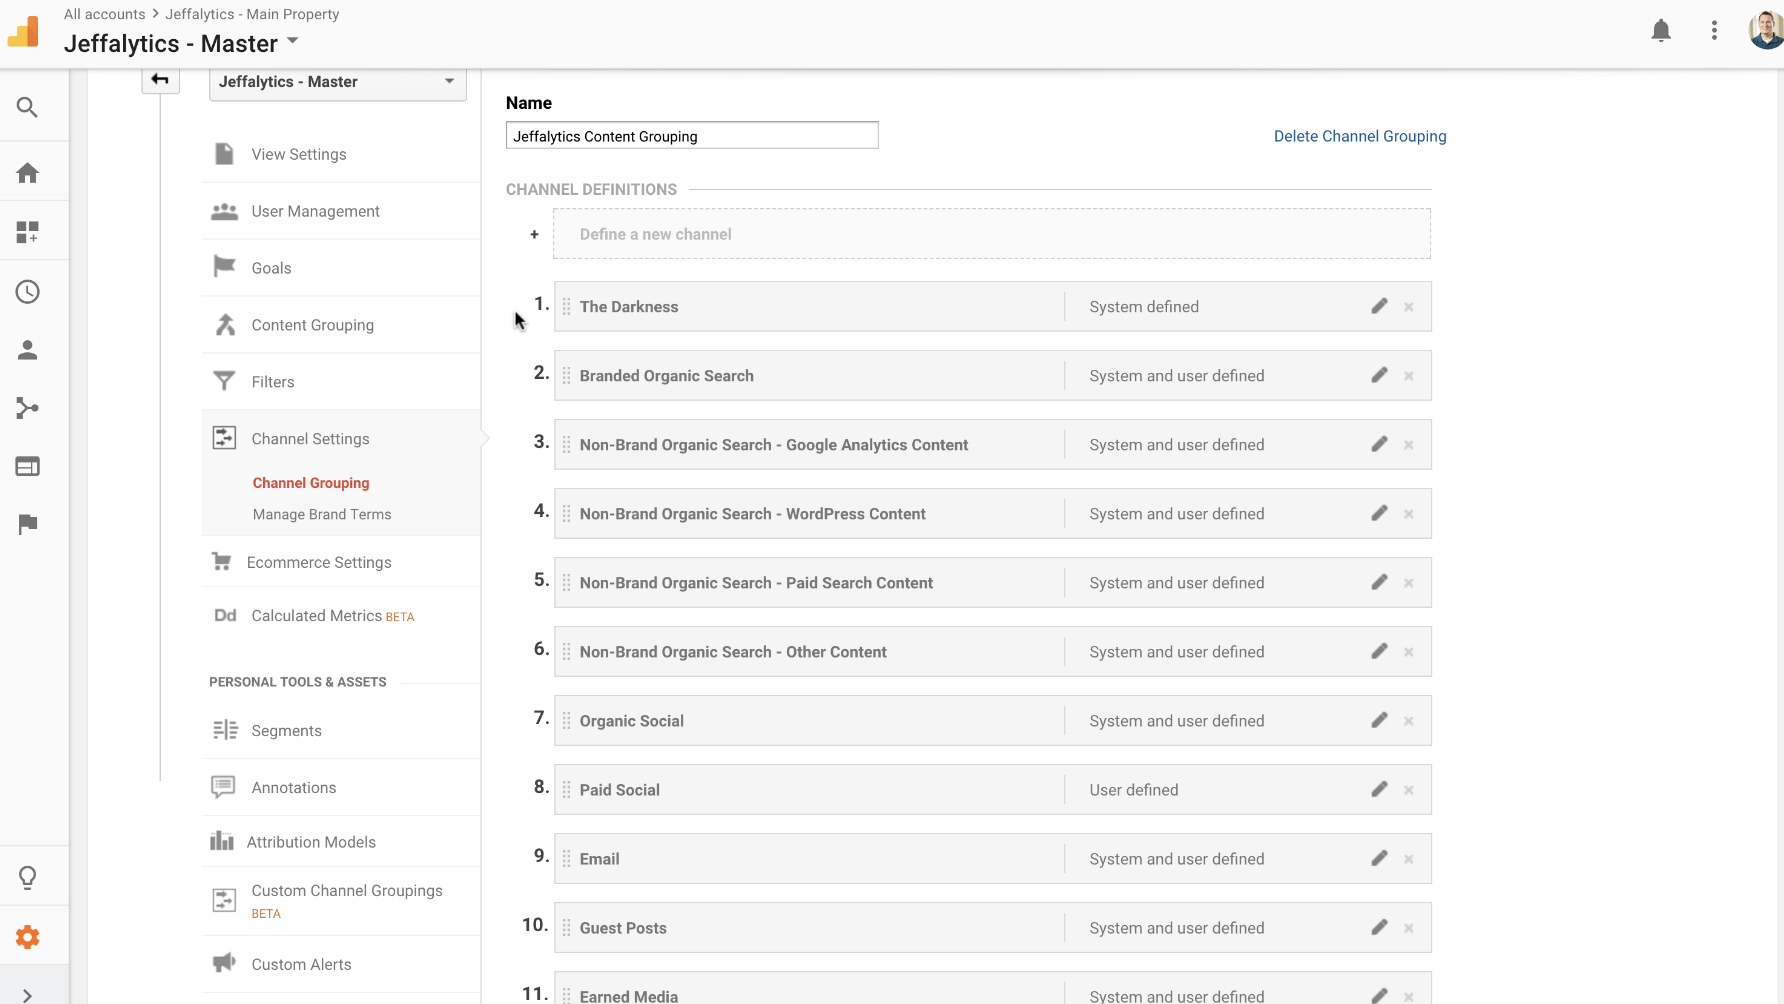
Once my Content Grouping is selected, you can see how much more depth I have in my channels.

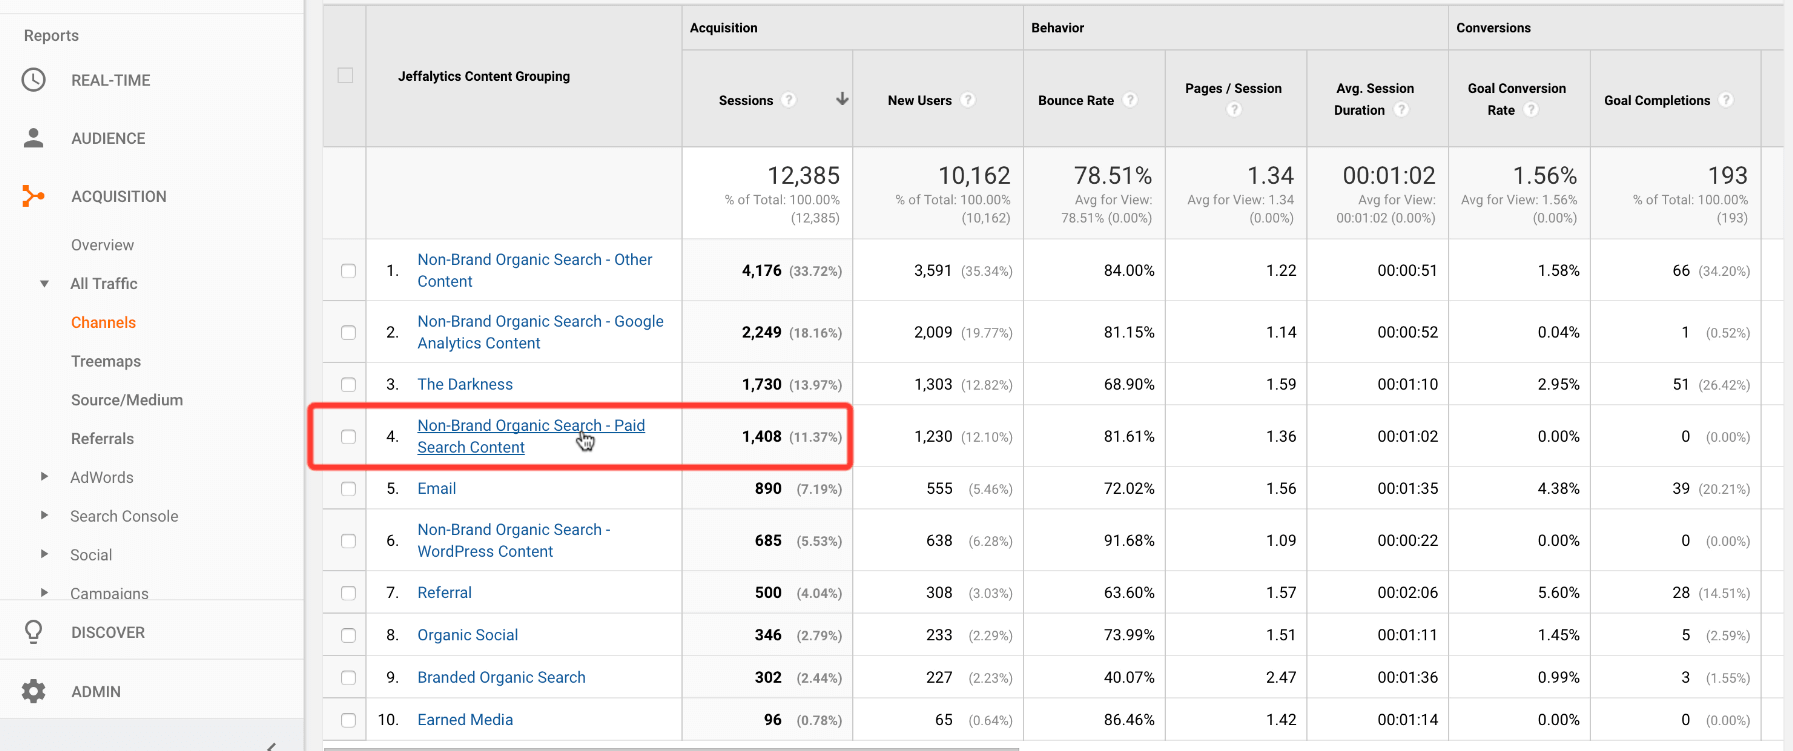
Where organic search was 70% of my traffic, I know have that traffic broken down into five channels.

Looking at the screenshot below, you can see all five of the channels that make up my organic search traffic. These channels represent five different types of searches people use to land on Jeffalytics.

  • Non-Brand Organic Search – Other Content
  • Non-Brand Organic Search Google Analytics Content
  • Non Brand Organic Search WordPress Content
  • Branded Organic Search
  • Non-Brand Organic Search – Paid Search Content

custom channel grouping in google analytics

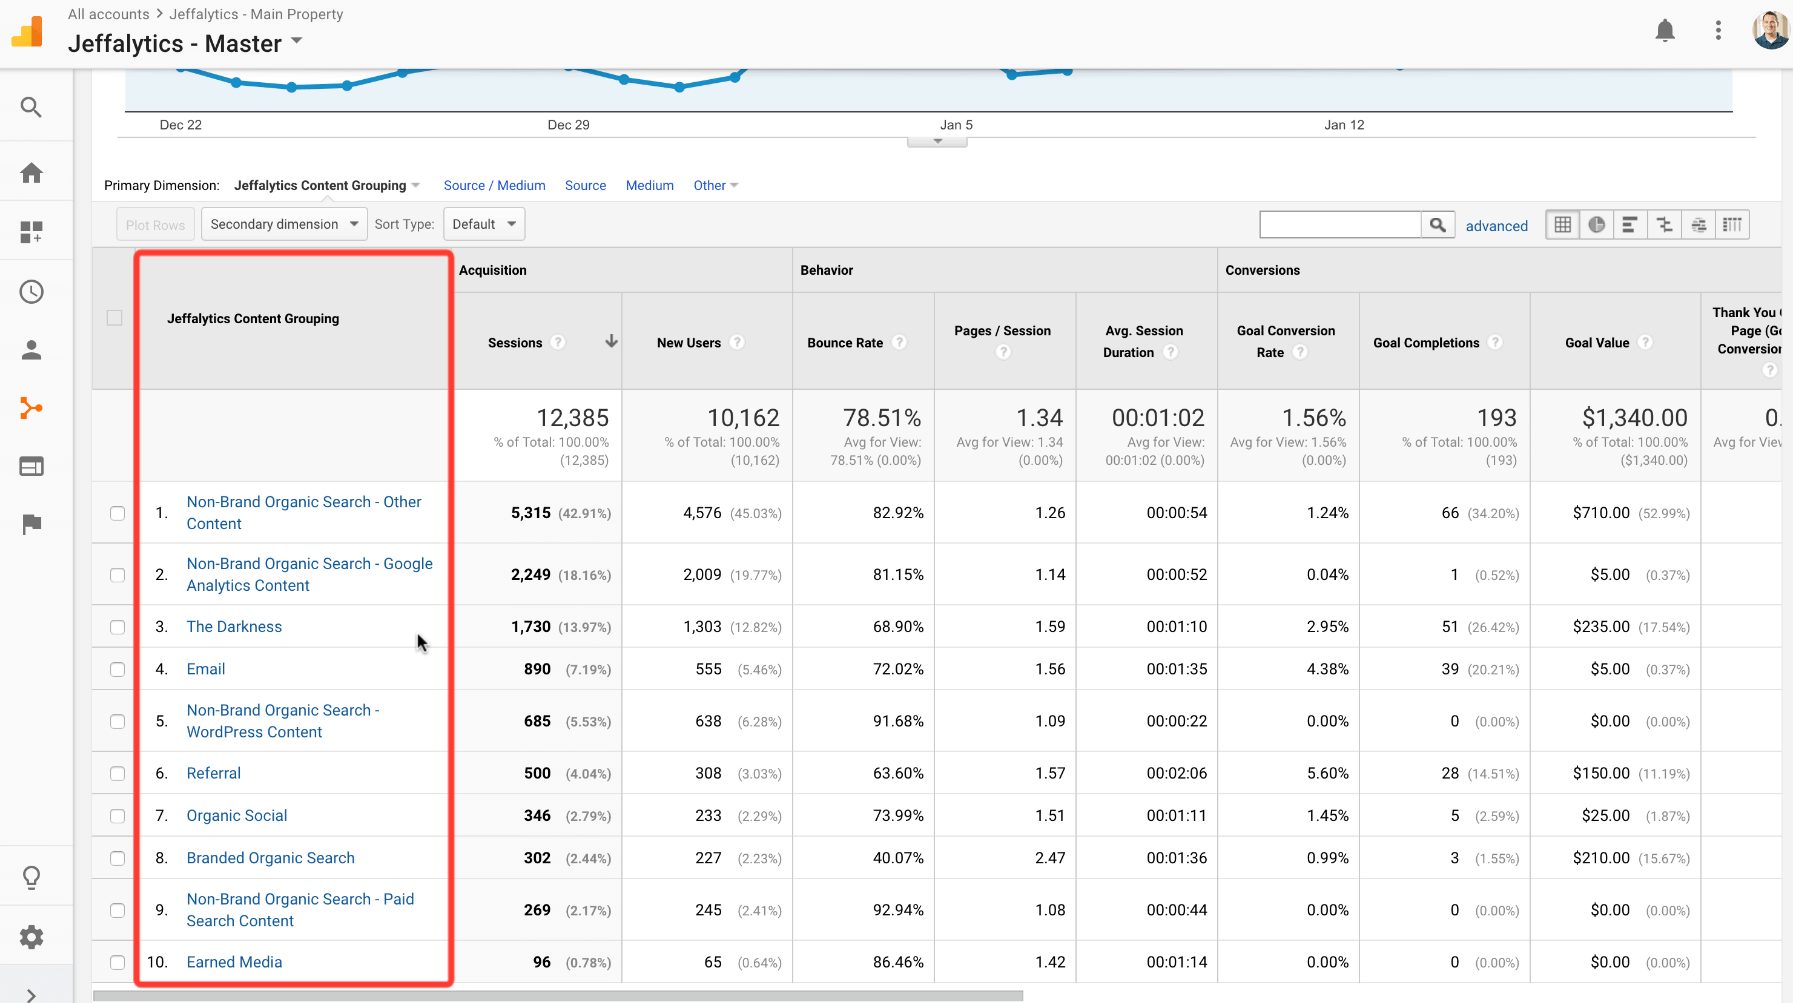
My custom channels allow me to do analysis I couldn’t do using the default channel grouping. I can see that people searching for Google Analytics content make up 18% of my total traffic. People looking for information about WordPress make up another 5.5% of my traffic.

Going beyond the default settings pays immediate dividends for my content analysis.

My direct traffic – now labeled “The Darkness,” is still the same. But this name reminds I can’t learn anything from this channel.

Channel landing page report

One channel that needs a stronger definition is my Organic search traffic related to “paid search” topics. If I dig into this non-branded organic search channel, I can see what’s missing. Many of my blog posts and landing pages about Adwords are not getting sorted into my paid search channel.

channel grouping

Watching me adjust this channel in the video will show you how you can create and organize your own channels.

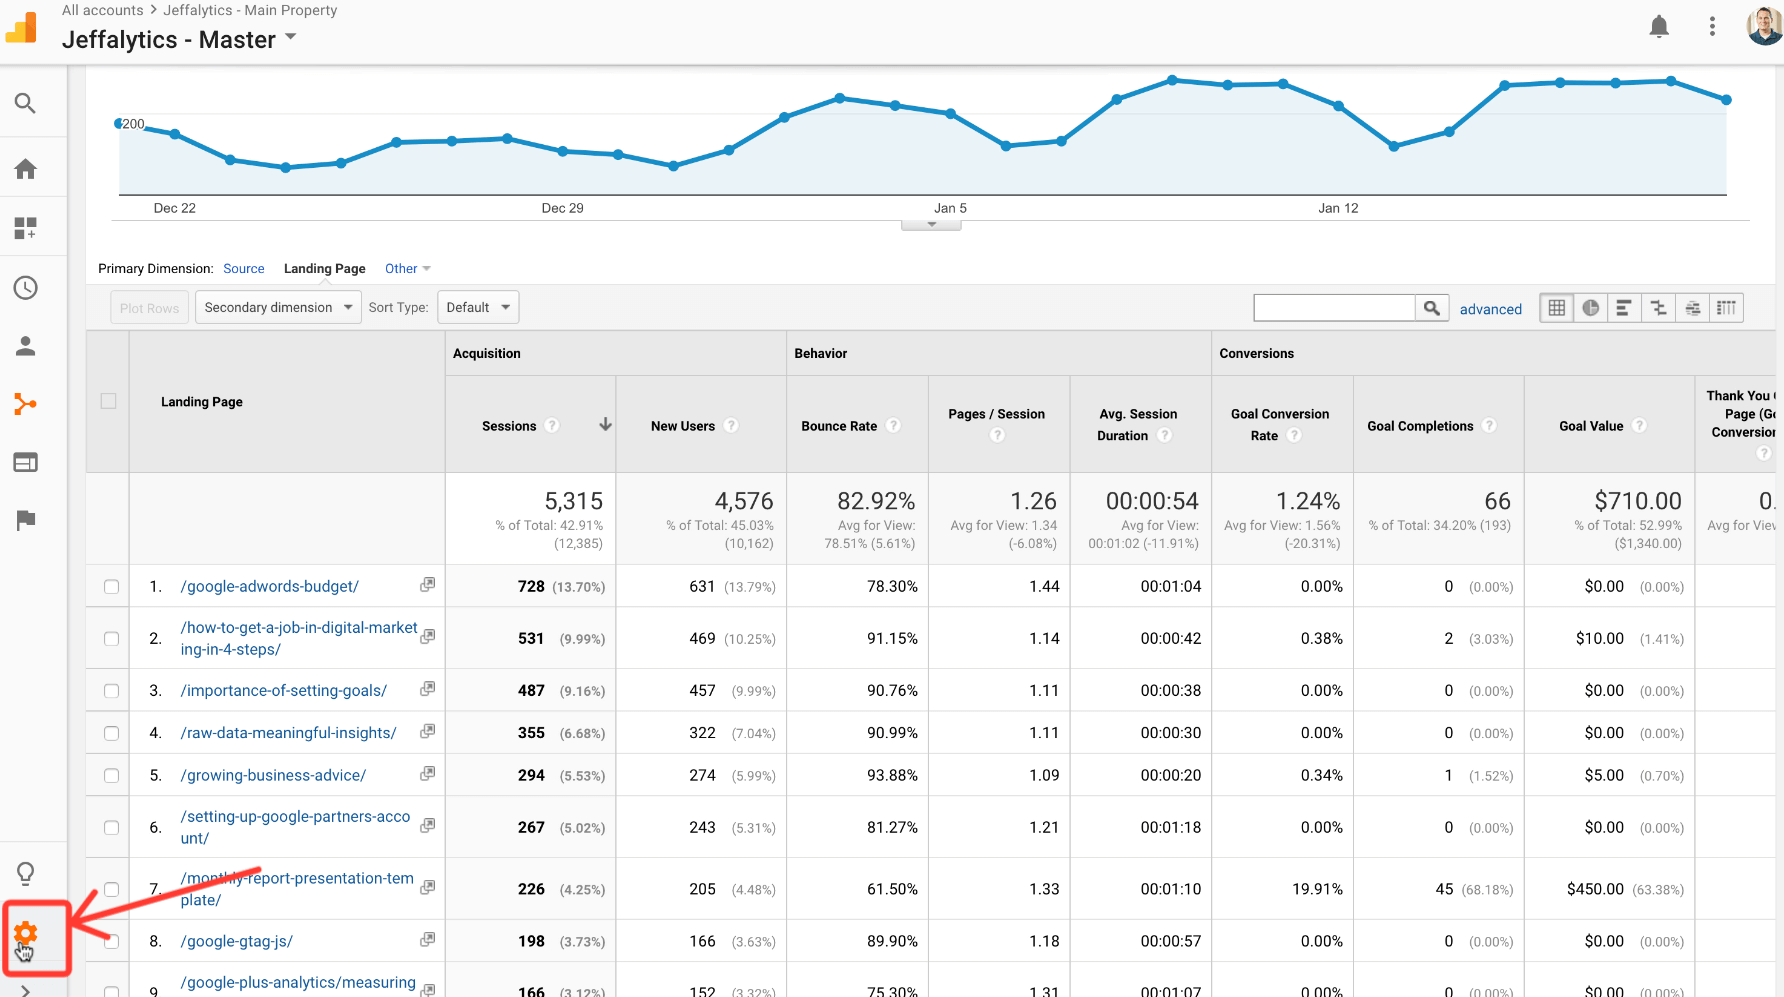
I can navigate to my channel settings by clicking the gear icon. The gear icon will take me to the admin section of Google Analytics.

Google analytics admin

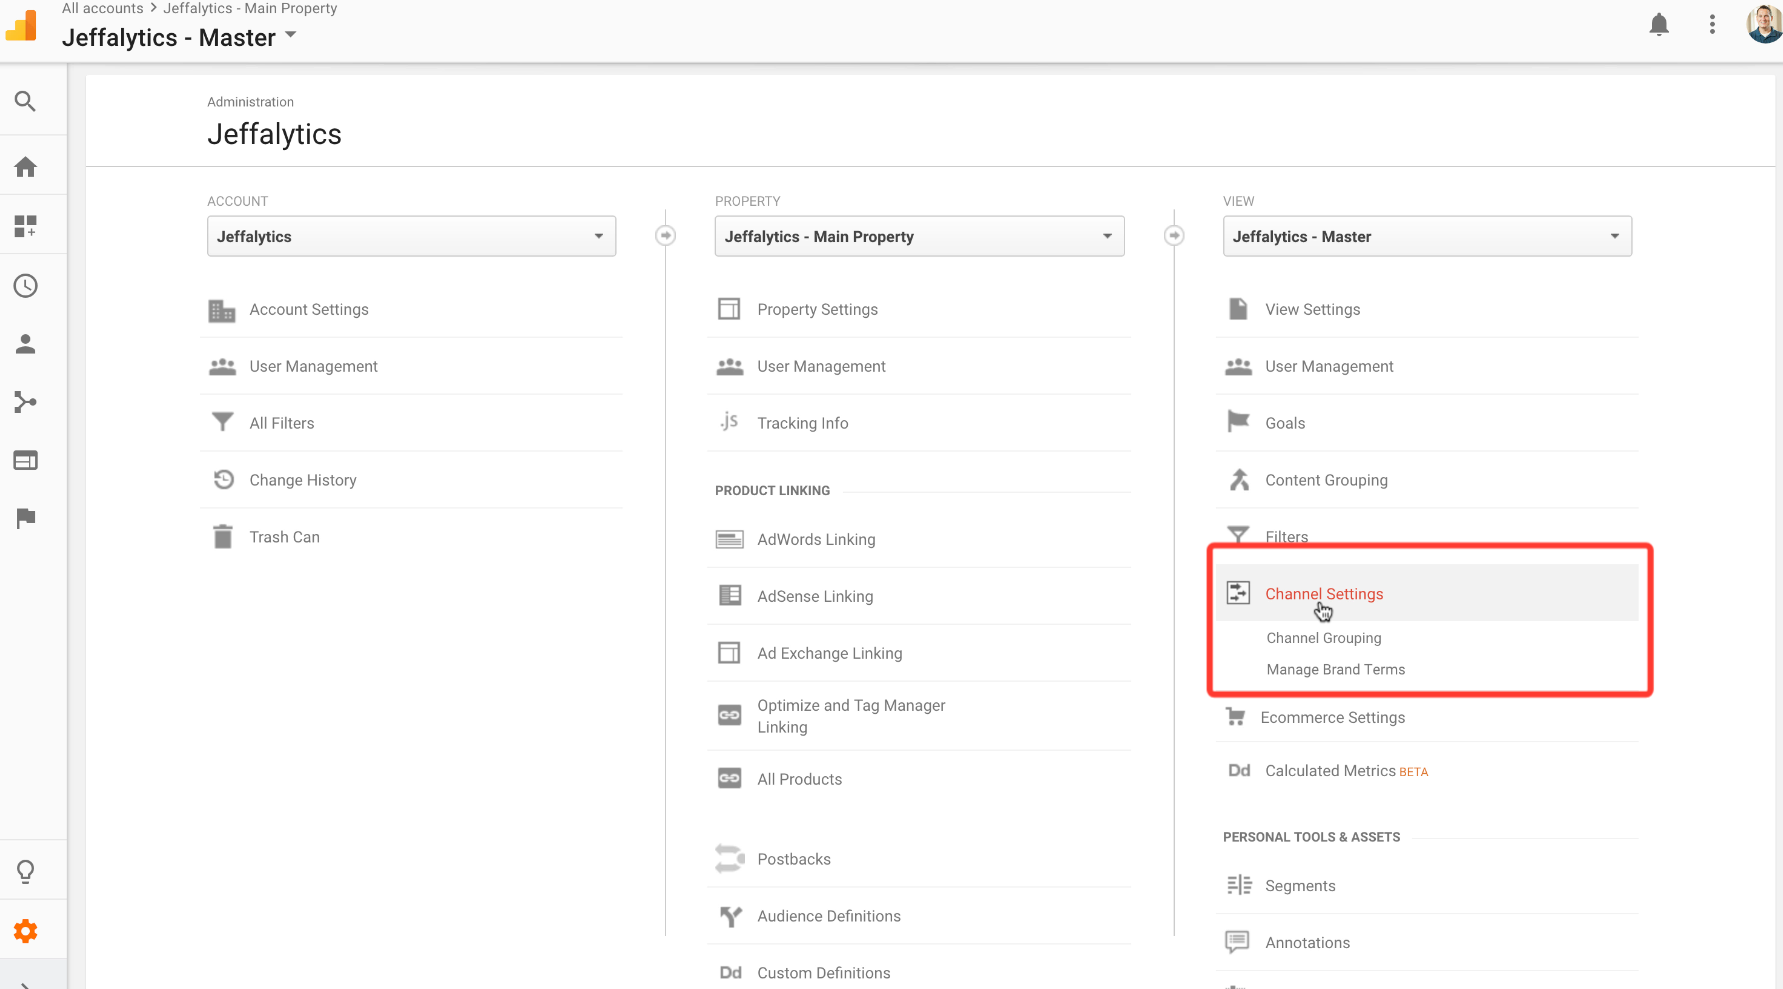
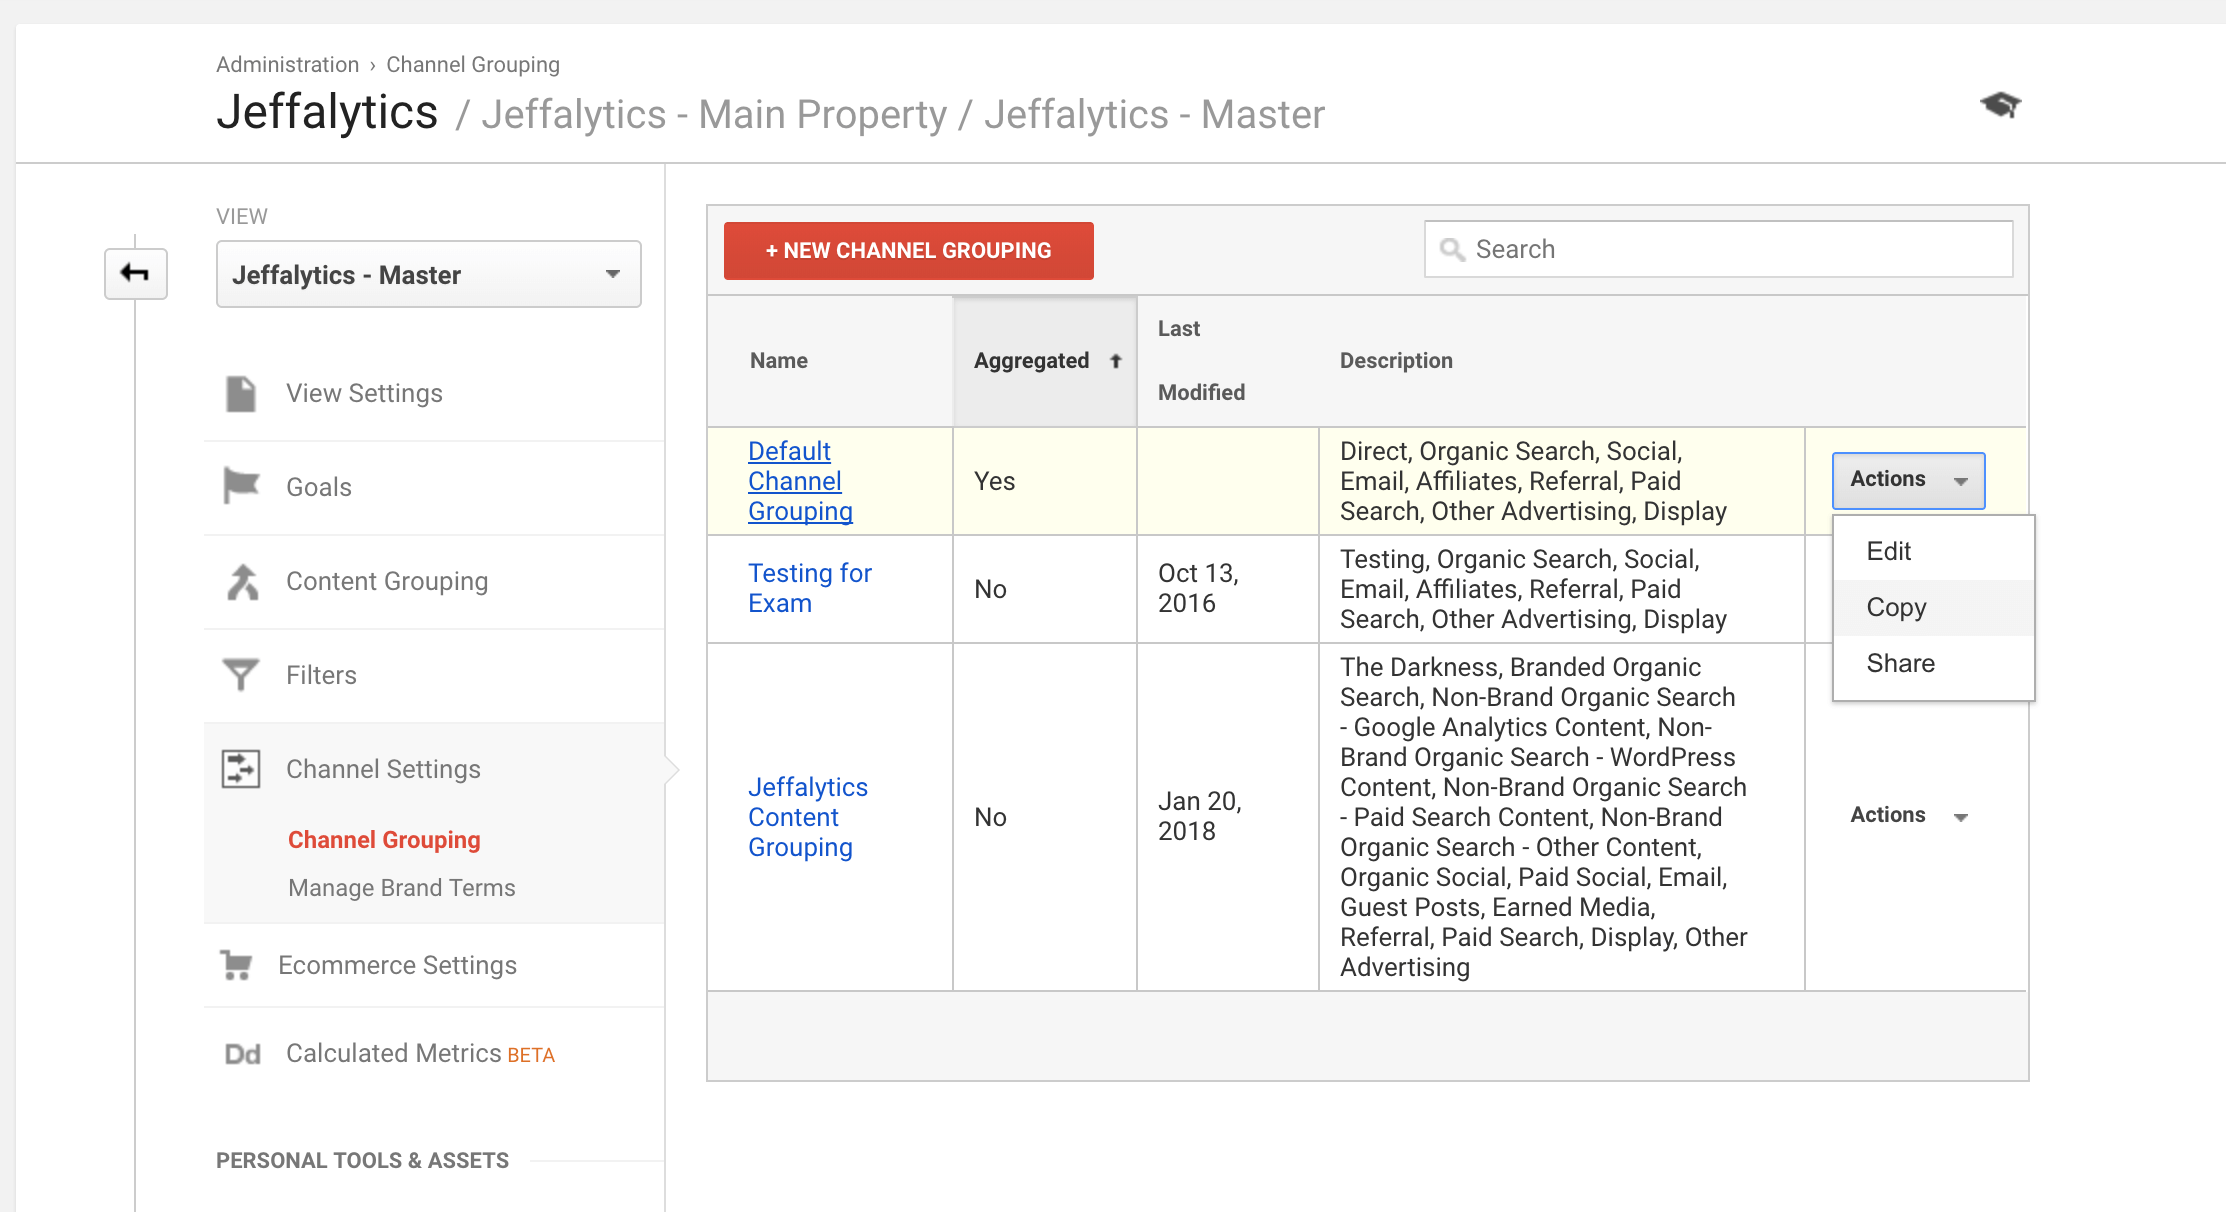
Once I am in the admin section, I click Channel Settings, and then Channel Grouping.

creating custom channel grouping in Google Analytics

This will take me to my current channel groupings. This is also where you can set up a new channel grouping for your account.

new channel grouping google analytics

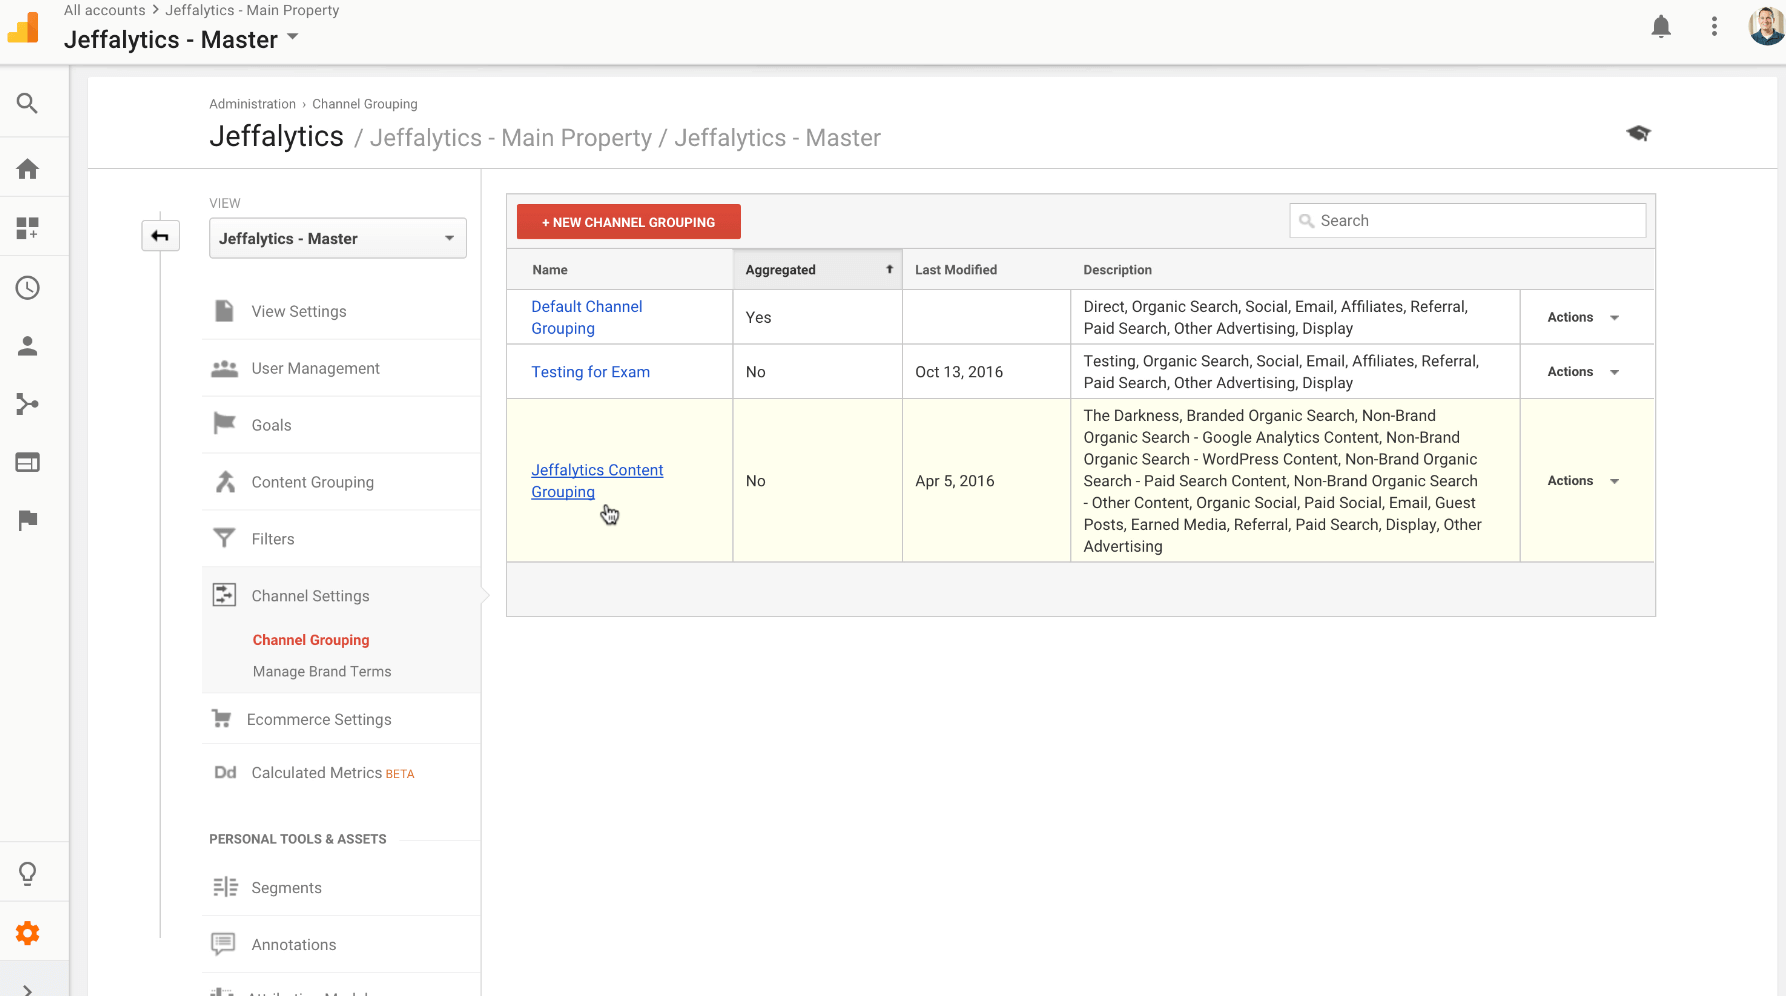
Selecting the Jeffalytics Content Grouping will allow me to edit my current channels.

Before I adjust my current channels, let’s look at how I organized some of my channels.

Branded organic search channel

People often ask how I break out branded organic search. This channel represents site visitors that searched for my name or brand. Organizing this channel is pretty simple. I set my channel Landing Page URL to “exactly match” jeffalytics.com/.

custom channel grouping in google analytics

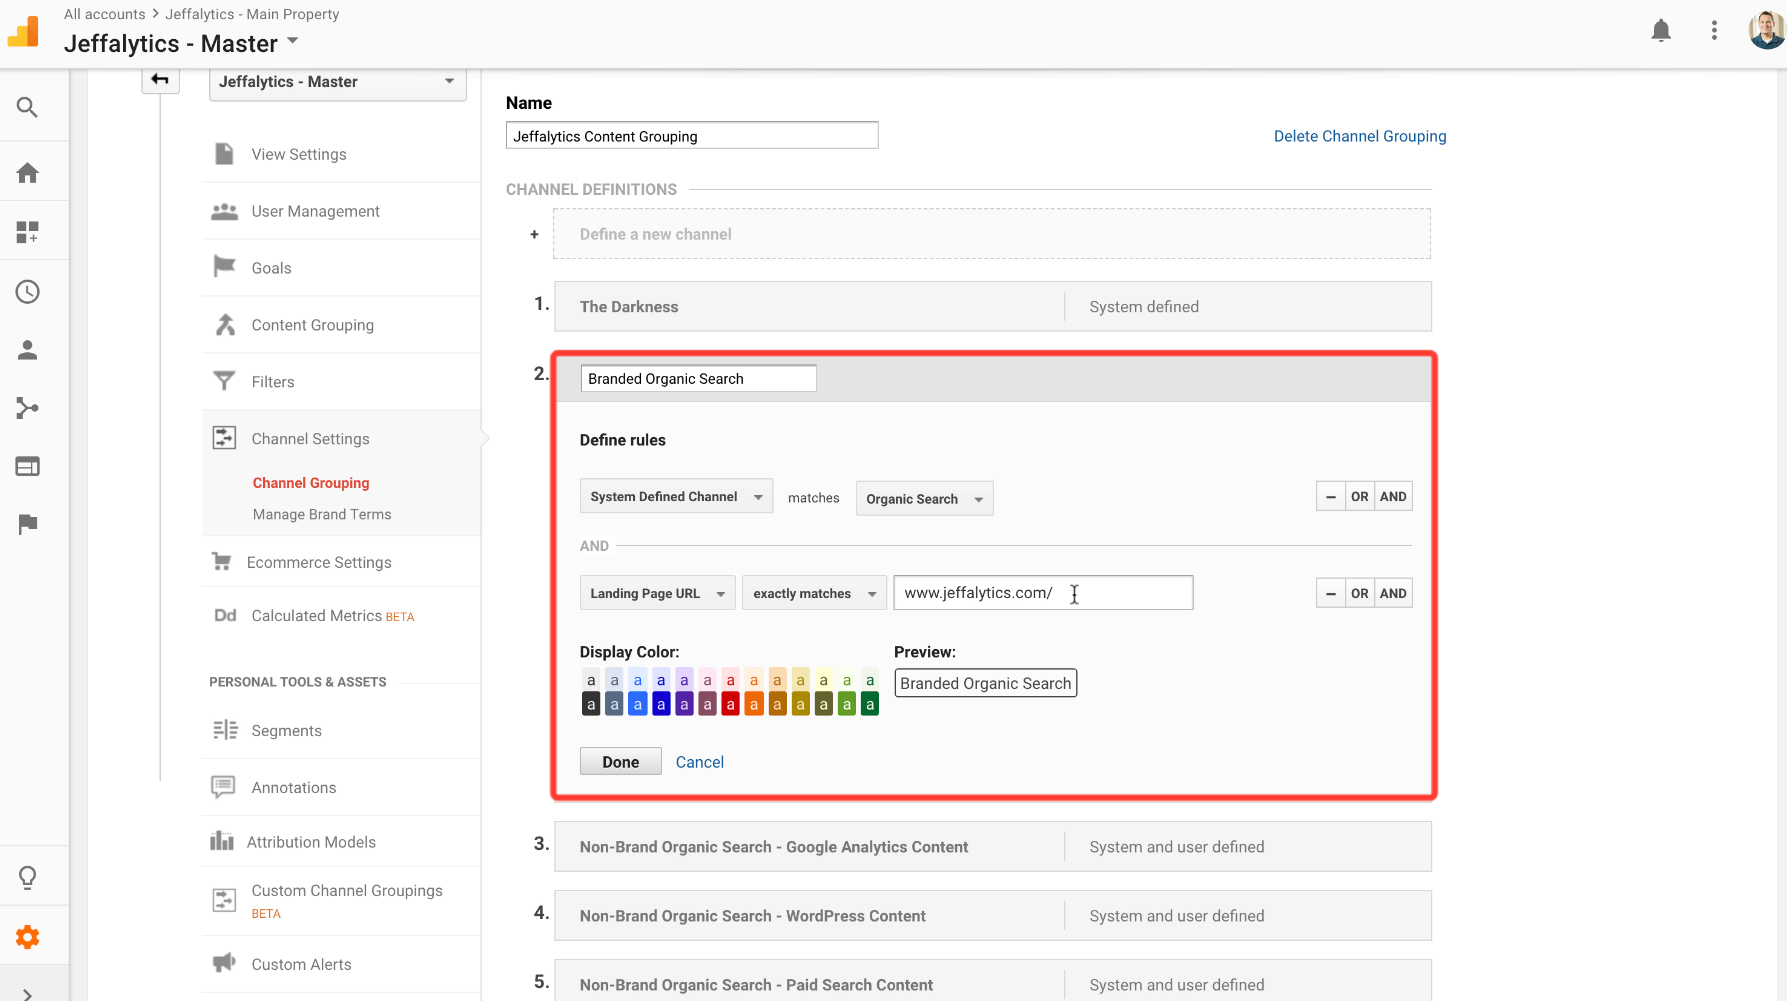
This strategy isn’t fool proof, but the logic is sound. If someone searches Jeffalytics or Jeff Sauer, they are likely to hit my home page in the search results. So I assume organic search traffic coming in on Jeffalytics.com is from branded searches.

Searchers that are looking for PPC or analytics will land on one of my posts related to that topic.

Adjusting channel grouping settings

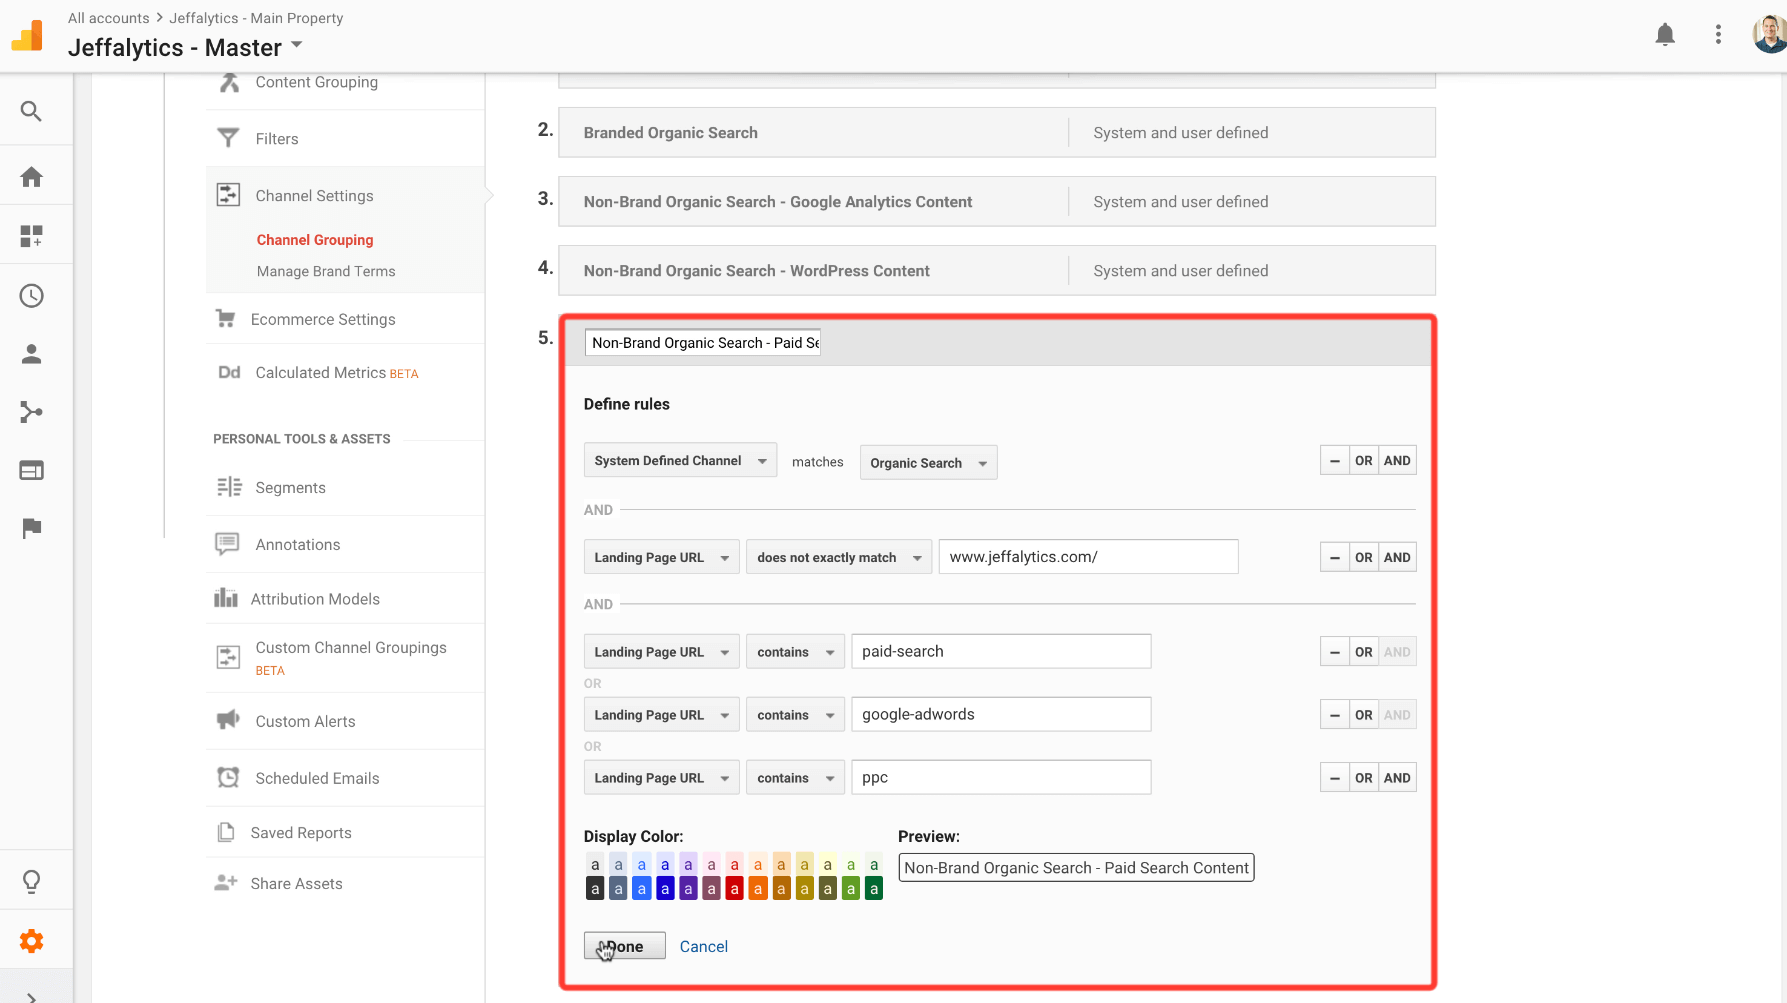
My Paid Search channel tracks traffic coming to my website from searches about paid search advertising. I have a flaw in this channel setting that I need to fix.

This channel is not set-up to include traffic from searches related to Google AdWords. I have also neglected to account for traffic that lands on my posts about PPC.  I can fix this problem by adding these topics to this channel.

To make this adjustment I’ll add in some “OR” clauses. I can tell Google this channel should include traffic that lands on my PPC or AdWords posts. You can see an example of how I do this below.

custom channel grouping in google analytics

Saving my channel grouping edits

After I am done adjusting my channel, I click to save my edits. Google says it can take up to 24 hours for my data to adjust to my new settings.

channel grouping edits google analytics

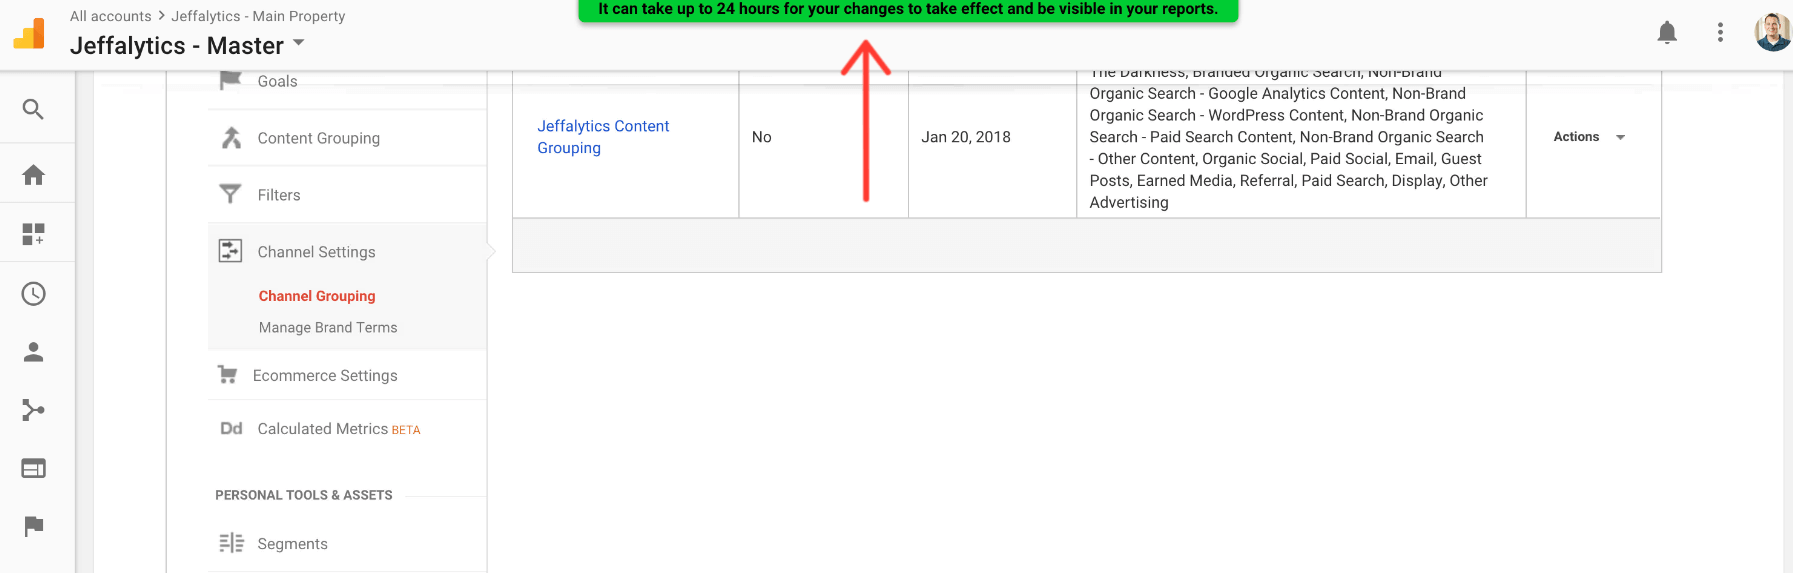
But when I click back to my dashboard I can see that my channels have already accounted for my changes.

custom channels in Google Analytics

Channel grouping strategy

Google recognizes channel groupings like a waterfall. Each group is a bucket. If a visitor doesn’t get captured in the first bucket, then they flow into the next bucket, and so on and so on. When a visitor doesn’t fit any of my main channels, they wind up in my “Other” channel. If my other channel makes up a very small portion of my traffic, then I know my groupings are working effectively.

custom channel grouping in Google Analytics

Here are five tips for improving your channel grouping in Google Analytics

1 – Aim from more, smaller segments

Channel grouping strategy

Use your channel grouping to break out your traffic as much as you can. Ideally, you want to get your channels down to groups that account for 10 to 15% of your traffic. The key is to organize your channels so you can do meaningful analysis. If 70% of your traffic is one channel, it will be hard to do learn anything from your channel report.

2- Call out your direct traffic

Channel grouping strategy

You don’t have to name your direct traffic “The Darkness.”

But it is worthwhile to call it out. Give this traffic a funny, or negative name, and remember not to worry about this traffic source.

3 – Classify as you feel comfortable

channel grouping strategy

You don’t have to re-organize all your channels overnight. You can create one new grouping. See if that change works. Then build more channels in that grouping as it suits your needs.

4 – Leave the default channels in tact

channel grouping strategy

The default settings do have value, so leave them intact. When you build a new channel grouping, create a copy of the default channels. Then edit the copy, so you don’t affect the default channel settings.

copy default channel settings

5 – Use the Source/Medium report more often

source medium report

Maybe setting up new a channel grouping in Google Analytics feels to complex? If that’s the case, you can use the Source/Medium report to do a lot of the same analysis.

The Source/Medium report can tell you both the “who” and the “how” for your website traffic. The “Source” represents who sent the traffic to your site. And the “Medium” represents how the traffic got to your site.

Setting up new channel grouping in Google Analytics can feel complicated. But it’s not very difficult once you understand how channels work.

Setting up custom channels is a great tool for analyzing your web traffic. Custom channels allow you to gain insight about your web traffic you can’t obtain using the default channels.

One of the “quickest wins” you can make with your Google Analytics account is to customize your channel names. It’s easy, it’s immediate, and it’s fun!

Leave a comment

What do you think about custom channels? Is this a technique you’ll use? Do you have custom channels already set-up? Leave a comment below with your thoughts on custom channel grouping in Google Analytics.


This post and video was episode 18 in our 90 Day Challenge digital marketing series.

To get access to all 90 days of videos, subscribe to our YouTube channel. YouTube will send our subscribers weekly emails about all the videos we published over the past week.

Want to know about each video and post as soon as it comes out? Sign up for 90 day challenge email newsletter. The newsletter will be the best way to make sure you don’t miss any of the content.

Filed Under: Google Analytics

How do Google Analytics sessions affect your website’s data?

January 31, 2018 by Jeff Sauer Leave a Comment

Google Analytics Sessions: No, this is not a collection of Google Analytics’s greatest guitar-shredding jams!

Sessions are how Google Analytics tracks each time your website visitors come to your site. Understanding sessions can be a bit confusing and figuring out how Google calculates sessions can get even more confusing.

Don’t despair. We have created this blog post and the video to clear up any session confusion.

We will explain how Google Analytics sessions are calculated. Then we’ll break down how sessions are tracked, and how they impact your analytics.

We’ll also show you an advanced strategy you can use to make sure your sessions are tracking correctly.

To round out this session jam, we’ll answer a question form our Analytics Course forum. Noel sent us an excellent question about sessions, hits, and pageviews. Answering Noel’s question will help you see how these measurements work together in Google Analytics.


How are Google Analytics sessions calculated?

When a webpage loads in a user’s browser window, that triggers the start of a session. Once the web page finishes loading, the analytics tracking code sends data to Google.

Think of it like your website sending out a bat-signal over Gotham city. In this case, your website is commissioner Gordon, Google Analytics is Batman, and your tracking code is Gotham city.

Ok, that analogy might have made you more confused. Fine, we’ll go back to the boring explanation.

The tracking code data you send to Google is recorded by Google Analytics for your account ID, and this marks the beginning of a session.

A session is the starting point for Google’s measurement of a web user’s experience.

A session can involve many pageviews and events that take place while a visitor is on your site. For example, multiple pageviews, a video view, and a purchase. Think of a session as the wrapper for everything that happens during one continuous website visit.

Google Analytics sessions

Image via: http://cutroni.com/blog/2014/02/05/understanding-digital-analytics-data/ 

Google Analytics sessions end after 30-minutes of inactivity

A session ends when a user leaves a website or goes inactive for 30-minutes. Inactivity, or “timing-out,” refers to a period of time when a user does not record a hit in Google Analytics.

When a user performs a new activity on a site following 30-minutes of inactivity, a new session begins.

What is a hit in Google Analytics?

A hit is any activity on a webpage that triggers a record in Google Analytics. The most common type of hit is a pageview. Hit activity can also include events, ecommerce transactions, and social interactions.

Google Analytics hit

Any time a hit occurs, it extends a session. A new 30-minute window starts following each hit.

Changing the default Google Analytics sessions settings

You can change the way that Google handles the time limit for your sessions. You can lower your sessions timeout interval all the way down to one minute, and you can increase it to four hours.

Default Google Analytics sessions settings

Changing your default session settings is not necessary in most cases.

There are some use cases for increasing sessions limits. Sites like Netflix, where users spend hours watching videos, may want to increase their session timeout limit. Using longer session intervals could help these sites improve the accuracy of their analytics data.

If you do change your sessions settings, keep in mind that the change will only affect future data. This type of change can make historical comparisons of your sessions very difficult.

It’s not something to be taken lightly.

Hit activity and Google Analytics sessions

Analytics Course customer Noel has the following questions about sessions, hits, and pageviews:

Google Analytics sessions

Noel wants to know how his sessions are tracked if he creates an epic blog post that takes over 30-minutes to read.

If Noel’s visitor spends 35-minutes on his page and then leaves, Google records one session.

Bounced visits

If Noel’s website visitor leaves after only one pageview they will also be recorded as a bounced visit. A bounced visit is any session that only includes one user interaction with a website.  In most cases this is a single pageveiw.

Does scrolling extend sessions in Google Analytics?

Noel specifically wants to know how scrolling down his blog post affects sessions.

To answer Noel’s question, by default, page scrolling is not recorded as a hit.  The default Google settings do not track page scrolling.  So, page scrolling will not extend sessions.

How event tracking affects sessions

There is a way for Noel to track scrolling on his page as an event. Using Google Tag Manager, or custom code, Noel can tell Google Analytics to record scroll depth on his page.

If Noel enables scroll depth as an event on his page, Google Analytics will record page scrolling as hit activity. That hit will then extend his visitor’s session.

What is a pageview?

Noel is a smart and inquisitive Analytics Course student (shameless plug). So, he also wants to know how pageviews are triggered in Google Analytics. And what a “view” means in Google Analytics.

A pageview occurs anytime a user’s browser executes Javascript (JS) for a webpage.

JS is the programing language that runs on the browser side (client side) of the web experience.

When JS is triggered for a webpage, Google Analytics records a page view.

Bots do not typically execute JS, which prevents them from recording page views.

Using Real-Time reports to see pageviews in Google Analytics

You can use your Google Analytics Real-Time reports to help you see what Google is tracking on your site.

Google Analytics real time report

You can find your Real-Time reports in the main area of your Google Analytics interface. Real-Time reports will show you users who are recording live pageviews on your site.

You can also see which actions are extending your visitors’ sessions.

Looking at hits and pageviews in your analytics code

A more advanced way to see a record of your Google Analytics tracking is by looking at the code that fires on your site.  You can view your tracking code on your site using the Chrome extension Google Analytics Debugger.

Google Analytics Debugger

After you’ve installed Analytics Debugger, open your web page. Then right-click and choose to inspect the page.

In your developer tools window select console and activate the Analytics Debugger extension.

Looking at pageview hits

The loading of your webpage should have triggered a hit for a pageview in Google Analytics.

Your pageview hit will look like this in your developer console:

Google Analytics pageview hit

Your console will also display any other hits that analytics records while you’re on your page.

To summarize everything:

Sessions are a group of interactions one visitor has with a website. They include pageviews and other events.  One session will last for up to 30-minutes, without any additional activity.

A hit is any activity or event that Google analytics records as user interaction on a web page.

An event is a type of hit that you instruct Google Analytics to record. You can set-up event tracking using Google Tag Manager, or custom code.

A pageview occurs when a user’s browser executes a webpage’s Javascript.

A bounced visit occurs when a user only has one interaction with a website in a 30-minute period.

Sessions are a very straightforward aspect of analytics. But they can be difficult to understand. People often assume Google Analytics records more than it does.

Google Analytics has vast capabilities. But, if you don’t set your analytics up to record user interaction, you only get the base levels of measurement.

Do you have questions about Google Analytics?

Post your question below.

We’ll answer as many of your questions as we can during our weekly videos and blog posts.


This post and video was episode 11 in our 90 Day Challenge digital marketing series.

To get access to all 90 videos, subscribe to our YouTube channel. YouTube will send our subscribers weekly emails about all the videos we published over the past week.

Want to know about each video and post as soon as it comes out? Sign up for 90 day challenge email newsletter. The newsletter will be the best way to make sure you don’t miss any of the content.

Filed Under: Analytics Resources, Google Analytics

How to get started as a Web Analytics Consultant

January 24, 2018 by Jeff Sauer Leave a Comment

So you want to be a web analytics consultant? Who wouldn’t? Web analytics consultants are the party animals of data analysis!

Plus, web analytics skills are in high demand. Consulting can be a great way to turn your skills into income.

But you have to have the right plan in place to make your consulting business work.

One of our Analytics Course students recently sent us a question about how to start marketing her analytics skills.

Becoming is a question I get a lot. So, In the post and video below, I’ll provide a detailed answer.

I will use my 12 years of experience as a web analytics consultant to share how to make a living in this business.

Chere, from our Analytics Course, wants to know how to get started as a web analytics consultant.

How do I become a web analytics consultant

Here are five things you need to do to get started as a web analytics consultant

1) Set your targets

How can you hit your target income?

As a web analyst, targets should be a familiar topic. Your income target is the yearly amount of income your business needs to generate for you to make a living.

To figure out how you are going to hit your target income you have to calculate the hourly value of your work.

We can use an income model from our Agency Jumpstart Course to help you find your hourly rate.

Target hourly income calculation

In this model, we estimate that you can work 2,000 hours in a year. 2,000 hours equates to 50 standard 40-hour work weeks.

Most consultants are billable about 75% of the time they are working.

With those numbers in place, here’s how to calculate your hourly target rate:

  • Add your business overhead to yearly income target.
  • Then multiply the number of hours you can work (2,000) by 75% to calculate your billable hours.
  • Divide the sum of your income target plus your overhead by your billable hours
  • The result is your target hourly rate

2) Choose a business model

You need to choose a business model. Your business model will determine how you get paid.

One of the most common consulting business models is the monthly retainer.

A monthly retainer has many advantages over project or hourly based revenue models.

To see how the monthly retainer model works, we can use another tool from Agency Jumpstart Course (AJC).

The AJC spreadsheet helps you calculate:

  • How many clients you need to land to hit your target income.
  • How much overhead you can have in your business.
  • And how much cash you’ll be able to generate each year.

You can download this spreadsheet here. [ddownload id=”14969″]

3) Develop relationships

Being a consultant is a relationship business. The more connections you have, the better your chances of sealing deals and reaching your income targets.

To develop business relationships, you need to put yourself out there. You have to let your network know about your business.

Here are some things you can do to help create more business relationships:

Start a blog.

Publishing blog posts can be a great way to become a thought leader in your niche.

You can also blog about how web analytics can help solve everyday problems. Remember, most people don’t even know what a web analytics consultant does. Relating your service to everyday problems will help your audience understand your value.

Create an email newsletter.

Even if you only have a small email list, a newsletter is a great way to stay in touch with your audience. You can use your email list to share your blog posts. Or you can use your email list to ask your audience questions. Learning about your email subscribers will help you build a stronger relationship with your audience.

There are many ways to let people know what you’re doing. As a consultant, you’re in charge of your business development.

Make sure to put yourself out there and let people know how you can help them.

4) Choose a niche

Once the business starts coming in, you’ll notice a wide range of need for your services.

Some clients will need you to install javascript on their websites. Others clients might want you to audit a Google Tag Manager installation.

You’re going to receive all types requests, which have you doing many different kinds of work. Working in so many different areas will prove to be very inefficient.

As an independent consultant inefficiency can stop you from achieving your revenue goals.

To make yourself more efficient, I recommend you choose two types of niches.

Client Niche

The first type of niche is client based niche. Think about the profile of your ideal client. What industry are they in? What properties do they have in common? And, what kind of business model do they use?

Then think about if you can scale working with that type of client. Are there lots of these kinds clients or just a few?

Knowing what type of client you want to work with factors into our second niche.

Service Niche

The second niche is service related. What is the ideal service you’d like to offer? You service niche needs to meet your entrepreneurial goals. But, it also needs to satisfy your business model.

Think about your service niche related to the types of clients you want to work with. Are you going to work with big companies or small companies?

Maybe you want to be a full stack web analyst, doing all the analytics work for a handful of clients.

Or maybe you want to focus on doing Google Analytics audits.

If you’re going to work on small-scale projects, you’ll need many clients. But, if you’re going to work with large companies on long-term projects, you may only need a handful of clients.

Make sure your service niche aligns with your income goals and your client niche.

5) Deliver the goods

Once you’ve identified how you’re going to make your business work, you need to able to deliver.

This comes down to making good on the services you say you can offer.

We all have to start somewhere and take on new projects. But, be clear about the services you plan to offer, and how and when you’ll fulfill your commitments.

I’ve been in web analytics consulting for a long time. And I’ve heard countless stories about consultants who didn’t deliver on their contracts.

The best way to be a successful web analytics consultant is to have lots of happy customers. Customers who recommend you to their friends and business associates.

Want to learn more about growing a freelance or consulting business?

Sign up for our Agency Jumpstart email list. Every Friday you’ll receive an email about growing a digital marketing business.

See what we did there? Email newsletter, relationship building. 😉

For more information, visit Agency Course


This post and video was episode 5 in our 90 Day Challenge digital marketing series.

To get access to all 90 days of videos, subscribe to our YouTube channel. YouTube will send our subscribers weekly emails about all the videos we published over the past week.

Want to know about each video and post as soon as it comes out? Sign up for the 90-day challenge email newsletter. The newsletter will be the best way to make sure you don’t miss any of the content.

Filed Under: Analytics Resources, Google Analytics

Setting Goals for 2018 [Our Actual KPIs at Jeffalytics]

January 11, 2018 by Jeff Sauer Leave a Comment

Today, I am going to publicly share with you our traffic and list growth goals for Jeffalytics in 2018.

Not only that, but I’m also going to share with you where I go to keep track of these results, and a plan for how I think we’ll reach these goals.

When I first got started blogging at Jeffalytics, way back in 2012, I had an idea to transparently publish my traffic goals on the blog each year. For the first two years I published these reports, but fell off the wagon in recent years. For reference, here are my previous goal setting posts.

  • 2013 Goal Setting
  • 2014 Goal Setting
  • 2014 Recap

Now that my audience has grown, I wanted to do a new goal-setting post. I think it will help many of you understand how I approach using analytics in growing a business.

Sound good? Let’s do this!

Traffic growth goals

Traffic at Jeffalytics has been flat for the past several years, and that’s something that I aim to change in 2018. Why is it flat? Because I have published less often, and the posts I do put up are not substantial, search optimized content.

Well, that’s going to change in 2018, particularly with the 90 day challenge. We will be publishing more often, and the content will have search engines fall back in love with me.

We’ll be bffs in 2018, to the tune of doubling our time together (twice as many sessions).

Yes, my goal is to double website traffic at Jeffalytics.

See my specific traffic numbers here.

List growth goals

Our list growth goal is very similar to the traffic growth plan. We plan to double our email subscribers in 2018, through a combination of optimizing email capture rates, and growing our baseline traffic numbers.

See my specific list goals here.

Our plan for accomplishing these goals

To accomplish our goals, we will be undertaking four major projects in 2018, one per quarter.

The first quarterly project is our 90 Day Challenge, which we announced last week. This challenge involves publishing 90 videos + 90 blog posts in 90 days. It’s going to be a lot of work (it’s already shaping up to be the most ambitious project I’ve ever been involved with, and we haven’t released a video yet), which means that it will deliver awesome results.

It’s the things that take 3x the work that deliver 10x results.

Each quarter after that, we will take on another project, and will let you know when those are ready to rock through this email newsletter.

So if you want to see the full plan for how we will get this done, check out our latest blog post on Jeffalytics.

And leave a comment or word of encouragement. I’d love to hear from you.

Filed Under: Google Analytics

Favorite New Features in Google Analytics and GTM

December 21, 2017 by Jeff Sauer Leave a Comment

As we near the end of 2017, you will start to see lots of “year in review” posts coming out over the next 2-3 weeks.

I’ll probably contribute one of those posts at some point as well, because it’s always good to summarize how far we’ve come (and remember the awesome work that we put into a year of building content).

But this week I wanted to share another type of “year in review” post – where the team at ConversionXL has gathered many of my favorite Google Analytics/Google Tag Manager friends and asked for a quote on their favorite new features in GA/GTM.

Here’s a link to that article: 11 Analytics Experts Share Their Favorite New Features of GA and GTM

You’ll notice that I am one of those featured in the article. My comment didn’t actually mention a feature in either product, but rather my thoughts on the UX improvements we’ve seen in Google Analytics in 2017. There are many that I thought deserved special attention.

Here’s my quote from the article.

My favorite update in GA in 2017 was actually the removal of several irrelevant items from the reporting interface. The new Google Analytics interface and home dashboard draws your attention to some of the most important reports to view in Google Analytics, and finally provides a meaningful overview from the get-go. This is opposed to the old audience overview report, which hadn’t changed in 10 years.

Not only that, but we are no longer inundated with useless or under-cooked reports like dashboards, shortcuts or automated intelligence. These reports were prominently featured in the GA navigation for years, but were rarely useful.

The biggest update in 2017 was to make Google Analytics more useful when you first log in. The first dashboard you see is actually useful… Only took 10 years to get there!

What has been your favorite advancement in Google Analytics or Google Tag Manager in 2017?

Would love to hear your thoughts by replying to this email – or if you are a student – posting in the Analytics Course forums, or our Facebook community!

Maybe we can compile enough quotes to run our own post (and give you credit of course!)

Filed Under: Analytics Resources

Google Closing Partners Certification Portal in 2018

December 6, 2017 by Jeff Sauer 4 Comments

For those of you who are certified with Google Analytics, or looking to obtain your certification, I wanted to call your attention to a new platform that Google will be rolling out on January 16, 2018.

Google is moving certifications from Google Partners to the Google Academy for Ads. If you are already certified, you should have received an email from Google with details about the switch (and how to transfer your certifications).

If not, hopefully this email triggers you to check out the new portal before the cutover date.

For years, we have been able to take our exams and store results in Google Partners – so this switch represents a significant change to how certification works.

It also represents a new batch of content produced by Google to help you learn how to use their platforms. Their tagline suggests this is “Fast and easy training from Google.”

Now let me start by saying that Google’s content is free, so you have nothing to lose by watching it. But I also want you to watch these videos with a discerning eye.

You know what else is free, fast and easy to watch? Television Commercials! 

Nothing good comes free, fast and easy. In the online marketing space, or life in general.

Good things take time. For example, Analytics Course is neither fast nor easy to complete. The majority of our students do not pass our beginner quiz on their first try.

But a funny thing happens when things are slow and hard. You work harder to achieve results. Nearly everyone who fails the beginner quiz in Analytics Course will go back and try it again. And on the second or third try? They pass the quiz.

Better yet, they begin to understand the concepts of Google Analytics more clearly. They revisit lessons to better understand the answers.

They turn information into knowledge. And that’s really cool!

In 2018, I’m considering developing a certification program that goes above and beyond what Google provides. It will be hard. Not everyone will pass. But those who pass? They will have a badge of honor (and a badge for LinkedIn).

I realize that not everyone on this list would be interested in a certification program, especially since the Google program is already so recognizable.

But I am curious if anyone out there would be interested in this type of advanced certification program?

Filed Under: Analytics Resources

  • « Go to Previous Page
  • Page 1
  • Page 2
  • Page 3
  • Page 4
  • Go to Next Page »

Primary Sidebar

Latest Blog Posts

  • How to use Google Signals and the Cross Device Tracking Reports
  • Google Analytics Tagging Guide and Checklist
  • The Complete Google Analytics Account Setup Guide
  • How To Measure Your Content Using Page Value – Not Bounce Rate!
  • Troubleshooting the Google Analytics Demographics Reports

Copyright © 2006 - 2023 · Digital Mantis, Inc.