• Skip to primary navigation
  • Skip to main content
  • Skip to primary sidebar
Analytics Course

Analytics Course

Learn Google Analytics Like an Expert

  • Home
  • Buy Analytics Course
  • Reviews
  • Blog

Google Analytics

How to use Google Signals and the Cross Device Tracking Reports

September 27, 2018 by Jeff Sauer Leave a Comment


This past July Google announced and released an epic new analytics innovation – Google Signals.

Signals is a built-in Google Analytics (GA) feature that allows you to enable cross-device tracking in your Analytics account, without any manual tracking code adjustments.

When Google announced the addition of automatic cross-device tracking to GA, my mind was bit blown. I knew Google had the data to create this feature, but I never imagined that they would share that data with us.

Well, they did! And now every Google Analytics admin can add cross-device tracking to their account with just a couple button clicks in their analytics interface.

Google Signals

How do we use Google Signals?

Google Signals represents some exciting new measurement and tracking possibilities. But as cool as this feature could be, right now it’s still a beta. And at the moment, there are some significant glitches in the cross-device reports. There are also a few critical intricacies you should be aware of if you’re going to test this feature out.

In this video and post, we’ll look at how to get started using Google Signals. Then we’ll go inside my Google Analytics account, check out the cross-device tracking reports, and learn about how Google Signals works.

Is Google Signals available in your Analytics account?

When Google Signals first launched, there was a lot of confusion about how to enable this feature. The problem wasn’t that Google Signals is challenging to set up, but rather that it did a brief disappearing act.

Disappearing Signals

Google introduced Signals at the 2018 Marketing Live presentation. I was so excited about this feature that I wrote about a week after it launched. And I advised everyone to look for Google Signals in their accounts.

Google marketing platform blog from jeffalytics

But when many of readers logged into their GA Accounts, Signals was nowhere to be found.

How do you set up Google Signals

Possibly Google didn’t release Signals to every account. Or Google briefly removed it to work out some post-launch problems. I am not sure why Signals vanished for a short period. But this new technology is for real. And by now, the beta version is hopefully available again in your account.

Why Google Signals is so innovative

There are a few reasons why Google Signals is capable of having a massive impact on the analytics community.

Could Signals be the end of manual cross-device tracking installations?

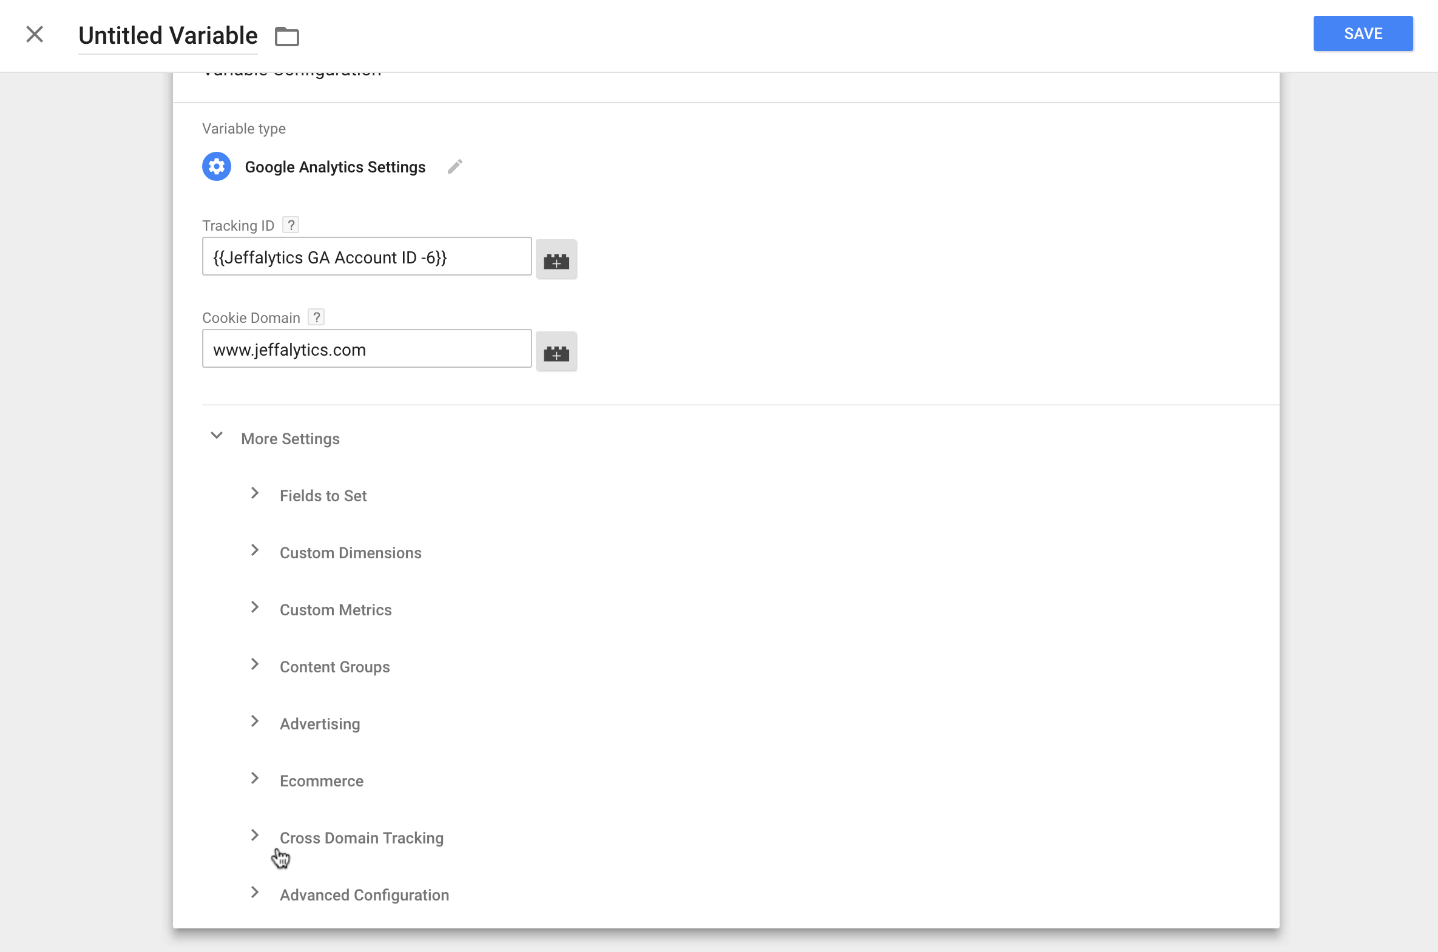
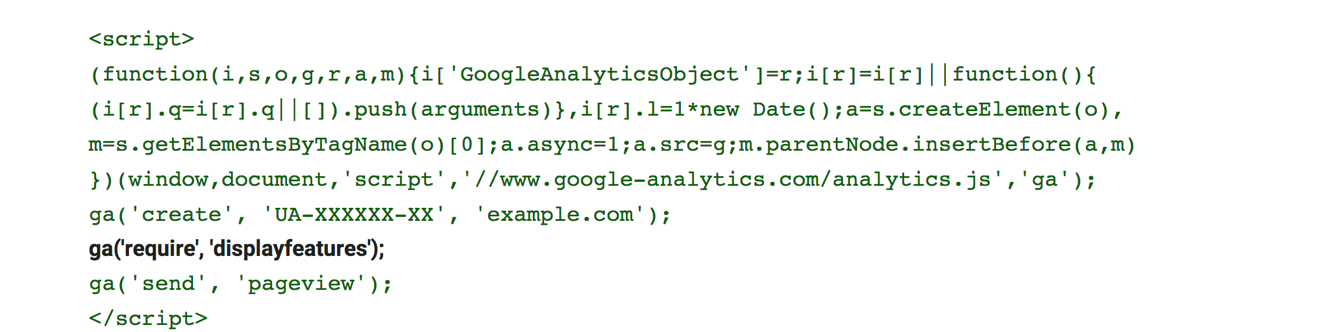
Google Signals may be capable of saving us from the complicated and often dysfunctional job of manually configuring cross-device tracking. Before the release of Signals, if you wanted to do cross-device tracking in Google Analytics, you had to implement custom javascript to replace you users’ Google Analytics client ID with your own unique non-personally identifiable user value.

Cross-device tracking for everyone!

As you may be well aware, implementing custom javascript to setup cross-device tracking is not a job for novice analysts or beginner programmers. This barrier to execution meant that only Google Analytics user with advanced skills, or companies with enough money to hire an adept Google Analytics programmer, could configure cross-device tracking.

But the average Google Analytics account owner doesn’t have the ability or budget to set up cross-device tracking manually. So those account owners were resigned to relying on data that was inflated by users visiting their site from multiple devices.

The release of Google Signals allows all Google Analytics account owners to put cross-device tracking in place. And in turn, Signals should increase the accuracy of everyone’s user data.

Google has more access and better data than you do

Another reason Signals is such a big development is that Google is better suited to match users across their devices than anyone else.

Google’s fully integrated domination of the search eco-system puts them in a better position than anyone to identify who we are on any device we use. This means that Google’s cross-device tracking technology is going to (eventually) be more accurate than any custom solution the rest of us can put in place.

Where does Google Analytic’s cross-device data come from?

So what portion of Google’s massive data supply are they sharing with us in our cross-device reports? Google’s documentation states that the data in your cross-device reports originates from the segment of your users that –

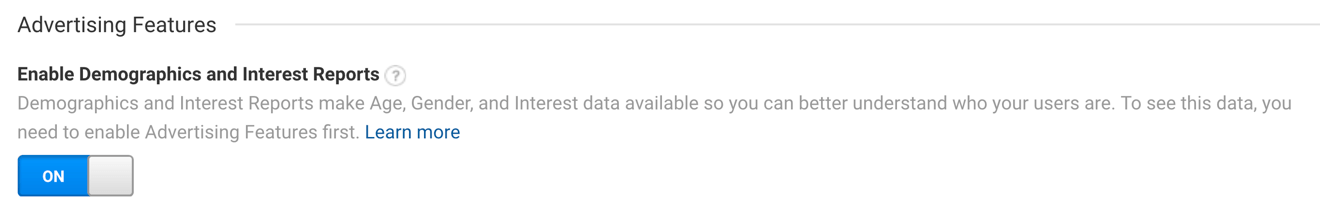
1) Are signed into their Google account in their browser

2) And have Ads Personalization turned on in their settings.

Google Signals data source

By default, Ad Personalization is turned on in everyone’s Google account settings. So just about every user that’s logged into their Google account can be tracked using Google Signals.

Ad Personalization

Setting up Google Signals

Alright, now that we know the background, let’s learn how to use Google Signals.

How to enable Google Signals

Setting up Google Signals is about as easy it gets. If you haven’t installed this feature yet, just click on your Audience reports tab and locate your cross-device reports. Then, click on any of the cross-device reports and Google will walk you through the set-up process. Be aware you will need to have edit permission to enable this feature in your account.

Setting up Google Signals

Cross-device tracking is not retroactive

Signals is not a retroactive feature. So your reports will be empty until your account accumulates enough data to start matching your website visitors with their devices.

26 months maximum

Google has also indicated that by default, they are only retaining your “signed-in” (meaning users logged into their Google account in their browser) user data for a maximum period of 26 months. However, if you have your data retention set for a shorter period, Google will dump your cross-device data based on your settings.

cross device tracking and data retention

What do the cross-device tracking reports have to offer

Device overlap report

The device overlap report features a Venn diagram that displays the portions of user devices that visited your site by device category. The raw user numbers in this report are likely to be very similar to your standard devices report. But the diagram provides a useful illustration of how many users visited your site on multiple devices.

device overlap report in google analytics

This report seems to require a good chunk of data to function. I’ve noticed that when I shorten the look-back period on this report to under 28 days, I lose any overlap data. So you may need to wait 30 days from the time you enable Signals to see any actual cross-device information.

Device overlap reporting time frame

Beta problems or an underwhelming report suite?

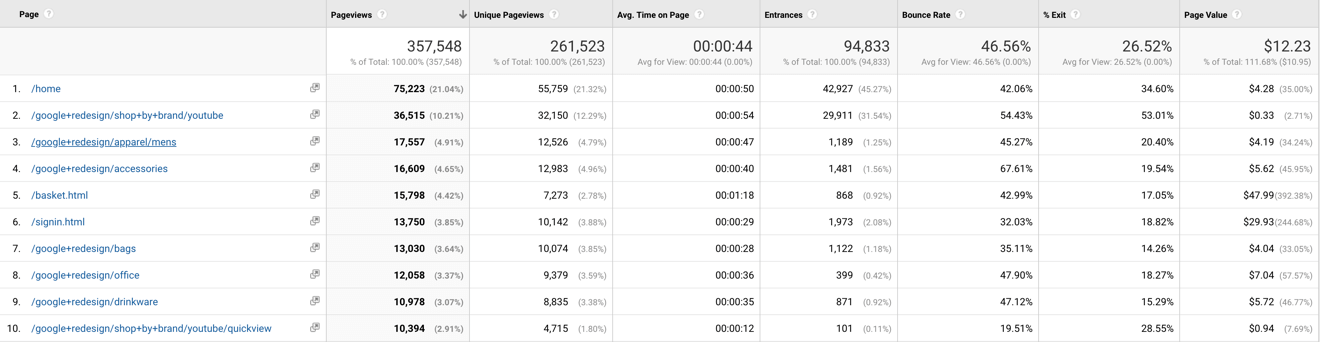
Right now the device overlap report doesn’t provide a whole lot of utility for analysis.

You have always been able to obtain most of the information provided in the cross-device reports within your device and mobile reports inside Google Analytics. So there is little new or useful information inside these new Google Signals reports.

The lack of useful information could just be a product of the site I’m analyzing since the majority of my traffic is exclusively desktop users. But it also appears Google is still working some kinks out of how they compile our cross-device data.

Focus on conversions

Another interesting aspect of the cross-device reports is the focus on conversion data. Understanding how device overlap contributes to our conversions could be very beneficial.

However (at least in my account) the goal values are completely broken. My total goal value is reported as $5,105. But Google calculates that my goal value per user is over $200K. That’s an insane number! While I value my website users that much, this is obviously an inaccurate calculation.

device overlap report goal value reporting glitch

Within the device overlap report, you can also drill down into device category, and device category by a user’s operating system.

Device overlap report by category and device

What’s lacking from the device overlap report

At the moment, the device overlap report lacks the most critical features I rely on as an analyst. Features like table filters and secondary dimensions. So there isn’t much I can do with this report outside of … well, looking at device overlap.

Device Paths Report

The device paths report is intended to help us see the different devices visitors use to interact with our content. This report also lacks depth. And the filtering options only function for traffic segments that have accumulated a significant amount of data.

Device paths report in Google Analytics

Channels Report

Right now, the channels report is essentially a less effective way of analyzing the same data that’s in your all traffic reports. There doesn’t appear to be any new information in this report that isn’t in your standard channel groupings.
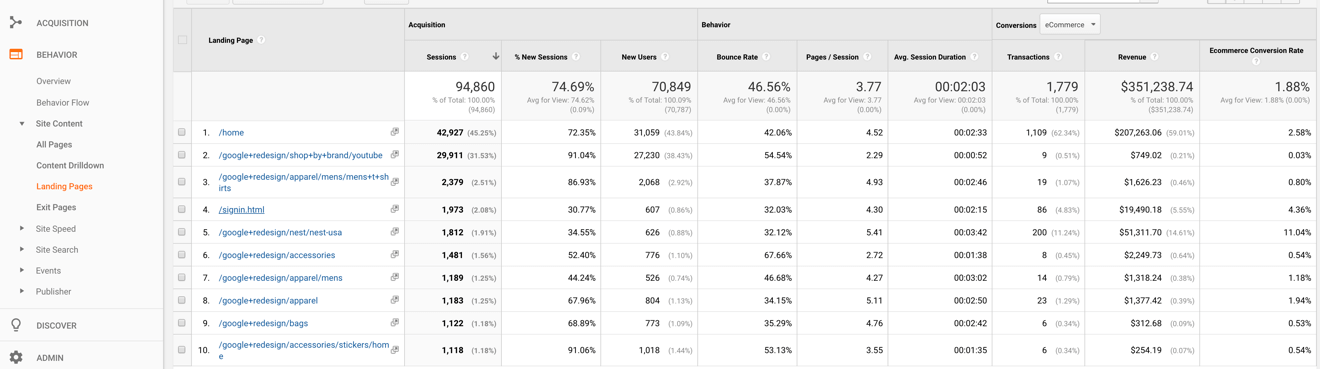
Channel cross device report google analytics

Acquisition report

My initial impression of the acquisition report is that it’s a more aesthetically pleasing view of the same data you can see in your device reports. As with the other cross-device reports, this one also lacks the standard GA functionality I’ve come to rely on for doing real analysis.

Cross device acquisition reports google analytics

Overall review of the Google Signals and the cross-device reports

At this point my overall impression of the cross-device reports is… Meh. Just plain, Meh!

The interface for this reporting area is slick and appealing. But since you can’t drill down into the data, there’s not much you can learn from the actual reports.

Another big concern I have is that Google tends to show us the latest variations on their platforms in beta. Then, they slowly integrate that new functionality across their entire product. I could just be viewing things from a “tinfoil hat” perspective here. But if the UI and functionality in the cross-device reports is an indication of changes to come throughout Google Analytics, then I am very concerned.

What you need to know about Google Signals right now

Here are the key things to be aware of when you’re experimenting with the beta version of your cross-device reports:

1) The focus of these report is really on conversions

Based on the beta version of Signals, it seems that our cross-device reports are going to focus primarily on conversions.

2) Some of the reports are broken right now

As you saw when we looked at my conversion metrics, some of the calculations and data in the cross-device reports are completely dysfunctional at the moment.

3) There’s no reason not to test out these reports (as long as you’re GDPR compliant)

In most Google Analytics accounts, it’s going to take at least 30 days to accumulate enough data to use the cross-device reports. So, as long as your Google Analytics tracking is GDPR compliant, you might as well go ahead and turn on Google Signals now.

4) Your mileage will vary

The utility you gain from cross-device reports will depend on the amount and type of traffic your website gets. As you saw from the analysis of my site, the cross-device reports won’t offer you a whole lot of beneficial information if 90% of users visit your website on one type of device. But if you have a site that earns a significant amount of mobile or tablet traffic, then the device overlap report can help you learn more about your user experience.

What signals are you getting from Google Signals?

So, I showed you inside my cross-device reports and shared my impression of Google Signals. Now I want to hear from you!

Leave a comment below, and share what you see in your cross-device reports. And let us know what you think of think of this new feature.

Keep in mind, the product development team at Google Analytics will listen to this feedback if we get enough responses. Especially feedback about technology that’s still in beta. So leave a comment with your thoughts, and we’ll see if we can Google to address our concerns.

Filed Under: Google Analytics

Google Analytics Tagging Guide and Checklist

August 22, 2018 by Jeff Sauer Leave a Comment

What’s the primary purpose of Google Analytics? To track, report and measure the activity that happens on your website, right?

Of course, tracking, reporting, and measuring the activities that happen on your website all require you placing some code on your website. You can’t get very far in analytics without tagging your site.

What’s a tag? Tags are those little bits of code your analytics tool providers or advertising platforms ask you to place on your website so that you can send data back to their servers.

From a Google Analytics perspective, making sure you install your tags the right way, and that those tags are in the right places, is critical to the data quality in your Google Analytics reports.

Better tagging = Better data = Better decision making

So how do you ensure that you’re using the right tags and that you’re installing your tags in the right places to get the data you need? Well, that’s we’re going to cover in this guide.

And because you asked for it!

Google Analytics tagging checklists votes

I’ve also included a Google Analytics Tagging checklist that you can use along with this guide.

[ddownload id=”26562″]

How to use this guide and checklist

You can download our Google Analytics Tagging checklist and save it to your desktop. Or you can print it out our checklist and use it to help you audit and upgrade your Google Analytics tagging.

This guide consists of three sections, basic tagging, advanced tagging, and exceptional tagging.

The basic steps, which are outlined in this guide, will help you check to make sure your Google Analytics tags are up to date and in the right places on your website.

The advanced and exceptional steps in this guide will be available exclusively to our Analytics Course students. To access the advanced portions of our guide as they are released, join us inside Analytics Course.

Ready to start checking your tags, and improve your tracking plan? Let’s do it!

Basic Google Analytics Tagging Steps

☐ Step #1: Review the tags Google has provided to you

You can find the latest version of your Google Analytics tracking code in the admin area of your GA account. The tracking code Google provides you for your site is located in your Tracking Info menu.

Google Analytics tracking code

Pro tip: Make sure you keep your site up to date with the latest version of the Analytics tracking code. Keeping your Analytics tracking tags up to date helps ensure that your data collection continues to work with all of Google Analytics latest features.

gtag.js vs. analytics.js

In October of 2017, Google updated the analytics tracking code from analytics.js to gtag.js. So, if your site is still tagged with analytics.js, you may want to update your code.

gtag.jsGTM Tracking templates and automatic updates

However, if you installed your tracking code using Google Tag Manager’s (GTM) Universal Analytics tag template, you don’t need to worry about updating your code. The GTM tracking template automatically updates to work with Google Analytics latest features.

GTM Google Analytics tracking template

(If you need help figuring out how, or where to put the Google Analytics tracking tag on your website, check out our Google Analytics account setup guide.)

In our next step, we’ll look at how to check which version of the Analytics tracking code is currently collecting data on your website.

☐ Step #2: Check to make sure your Google Analytics tracking code is valid

You can use the Google Chrome extension Tag Assistant to do a quick check of your website’s primary tracking tags.

☐ Install Tag assistant

Google Tag Assistant

☐ Review the tags on your site

Tag Assistant will show you which version(s) of the Analytics tracking code your site is currently using.

gtag.js in tag assistant

If you’re using GTM, you should see your GTM tag in your Tag Assistant report.

Tag Manage tag in Tag assistant

☐ Do you have any errors in your tags?

Tag Assistant can also help you find problems or errors in your tags.

Tag assistant errors and recommendations

☐ Is your site tagged with a tracking code that doesn’t belong to your account?

Using Tag Assistant, I discovered that a third-party had slipped a tracking tag onto a site I was analyzing.

tracking tag error

This tracking tag could cause a privacy or GDPR violation for this website. So, I need to find the source of this tag and make sure it’s permanently removed from this website.

☐ Do you want all this tracking code in place?

Another thing I noticed in my tag assistant report is that this site I’m reviewing is sending three hits to Google Analytics. It’s possible this site is tracked in multiple Google Analytics properties for a reason. But these tags might also be an unnecessary duplication of reporting.

Errors in tag assistant

Try to make sure the data you’re collecting serves a purpose. Removing unnecessary tags from your site can decrease the potential for privacy violations, and also help declutter your analytics.

☐ Step #3: If you are using GTM, check your tracking tags in Preview and Debug Mode

You can also check your tracking tags inside of GTM. GTM’s preview and debug mode will show you all the Google Analytics tags that are running on your site, where your tags fire, and how they are working.

GTM preview and debug mode

(Want to master the fundamentals of using GTM to manage your tracking tags? Sign up to join our GTM Course.) 

☐ Step #4: Check every page on your site for your Google Analytics tracking code

Most content management systems (CMS’s) allow you to tag every page on your website when your install your Analytics code. But it’s a good idea to do a quick check to verify that you didn’t miss any pages when you tagged your site.

You can scan your entire website for your tracking tags using a free tool called GA checker.

☐ Go to gachecker.com

Ga checker

☐ Run a report for your site

When I scanned my site using GA Checker, I was able to verify within minutes that all 471 pages on my website are tagged with my Google Analytics tracking code.

Ga checker Google Analytics tagging report

☐ Tag any pages you’re not tracking, as needed

GA Checker also allows you to download a complete report of your site scan. Use your site scan report to help you find any pages where you need to add the Analytics tracking code.

☐ Step #5: Run a real-time test of your tracking

One of the best ways to validate your Google Analytics tags is with Google Analytics.

You can use the Real-Time reports in Google Analytics to verify your site’s tracking and reporting.

To run this test, visit the real-time reports in Google Analytics.

☐ Navigate to your website

Google Analytics checklists

☐ Open up your Google Analytics Real-Time reports in an unfiltered view

You need to use a view that doesn’t block your IP address from your Real-Time reports so that you can see the hits your sending into Google Analytics.

☐ Review the data in your Real-Time Reports

You should be able to see the page your on right inside the real-time reports.

Google Analytics real-time reports

Using the location filter you can track the geographic data your sending to Google Analytics.

checking your location tracking in your Google Analytics real-time reports


You can check to make sure your source/medium is tracking correctly in the Traffic Sources report.

checking your source/medium in Google Analytics real-time reports

And you can see any events tags you triggered in the Events report.

Real-Time event tracking test

How did your Real-Time test go? Are your Google Analytics tags working correctly?

Let’s quickly review the steps you can follow to fix any broken Google Analytics tags.

Fixing broken Google Analytics tracking tags

1. Update your Google Analytics tracking code to the latest version or install your Google Analytics code using GTM.

Updating your code, or migrating to GTM can often solve your tracking problems.

2. Add tags to any pages that are not getting tracked

As we discussed, most CMS’s allow you to tag your whole site at once. But if you’re concerned that pages on your site are not tagged correctly, use GA checker to scan your site. Then go back and tag the pages on your site that you missed.

3. Remove unnecessary tags from your website (especially from third-parties).

Third-party code can cause privacy violations. Consider removing any third-party tracking code that you find on your site.

4. Use the Real-Time test to see if the tags you updated are tracking correctly.

Using your Real-Time reports to check your tracking is a highly manual process. But the Real-Time test is also a great way to make sure you Google Analytics tags are tracking all the data you need for your analysis.

5. Periodically scan your site to make sure all your pages are tagged

You can use GA Checker to routinely scan your site and double check that all your pages have Google Analytics tracking tags.

That wraps up the basic steps in our Google Analytics tagging guide.

Want to keep going and learn how to upgrade your tagging while building a complete website tracking plan?

Join us in Analytics Course to continue with our guide.

What’s your favorite tool for checking tracking tags?

As always, I want to hear your comments and questions. Which tools do you use to check your Google Analytics tags? Tag Assistant? GTM? GA checker? Leave a comment below with your favorite tool for testing your Google Analytics tracking tags.

Filed Under: Analytics Resources, Google Analytics

The Complete Google Analytics Account Setup Guide

August 16, 2018 by Jeff Sauer Leave a Comment

The complete Google Analytics account setup and optimization guide

Google Analytics is awesome. Just sign up for an account, put some code on your site, and you’re analyzing traffic in minutes!

And therein lies the problem!

The problem with the default Google Analytics installation settings is that it’s too easy!

With Google’s one-size-fits-all solution for tracking, you can get data in minutes. But using a solution designed to report on the same data for every website on the internet isn’t likely to provide you with the insights you need to improve your marketing.

The purpose of this Google Analytics account setup and optimization guide

This guide and checklist are designed to help you create a plan that customizes the data you collect in your Google Analytics account to better match your organization’s needs. By customizing your installation, you can turn your Google Analytics account into a high-value, data-driven machine that provides you with the information you need to take action and improve your marketing.

That sounds pretty great, doesn’t it?

How to use this Guide

This guide is not necessarily meant to be completed all at once. While many steps are easy to implement and only involve checking a box in your Google Analytics settings, other steps involve significant account configuration.

To help your work through all these steps at your own pace, we’ve included a checklist that you can download and save on your desktop or print out.

[ddownload id=”26561″]

If you get stuck on any of the account set up steps, don’t be afraid to leave a comment on this post with your questions.

There are three sections to this guide, covering beginner, intermediate and advanced topics.

Within this guide, we have linked to many other resources that will help further your understanding of how to build and optimize your Google Analytics account. You use Analytics Course to help you master all the steps in this guide and build a fully customized Google Analytics account right away.

Ready to turn your Google Analytics account into a customized business solution? Let’s get started!

Beginner Level Google Analytics Account Setup Steps

Steps 1 through 6 in this guide apply to every Google Analytics user. No matter your level of expertise, you should be able to accomplish these tasks.

Define the objective of your website

Defining the objective of your website is crucial to getting the most out of Google Analytics.

Businesses will have different data collection and reporting needs based on the purpose their websites serve. For example, a site that’s designed to be informational will have entirely different goals than an e-commerce site. And a lead generation site will want to focus on different metrics than an affiliate site.

Setting your website’s objective will guide how you customize Google Analytics to track your results in future steps. So identifying what objectives your website should serve is the first, and most important step in your Google Analytics game plan.

Below is a list of some of the most common website functions and objectives. You can use these examples to help define your website’s primary purpose.

Website objectives

☐ Blogging (More Pageviews)
☐ E-commerce (More Sales)
☐ Lead generation (More Leads)
☐ Affiliate (More Commissions)
☐ Advertising (More Pageviews)
☐ Informational (More Pageviews)
☐ Membership (More Sales/Customer Satisfaction)

the objective of my website is to:

Create a free Google Analytics account if you don't already have one

Now it’s time to create a Google Analytics account (If you don’t already have one). To set up a Google Analytics account, you need a Google Account. Per Google, a Google account is “One free account that gets you into everything Google.” Think of your Google account as your master access point for all your Google products and tools.

☐ Create a free Google Account (This is required to set up Google Analytics)

Google account

Once you have set up a Google account, you can create your Analytics Account. To set up a new Google Analytics account, navigate to the Google marketing platform. Then, choose to start a new Analytics account.

Google marketing platform

☐ Create a free Google Analytics account using your Google Account

Next, you’ll be greeted with Google’s three-step setup process. We are going to complete step 1, and then map out the rest of our account before we move on to steps 2 and 3.

Google Analytics account setup process


☐ Create a property and view for your primary domain name to be tracked with Google Analytics.

Note: Any account name will work here. You can always update the name later.

creating a google analytics account

When you create your account, you’ll need to give it an account name, enter your website name, and input your domain name. After you complete these steps, Google will generate your tracking code for your website.

☐ DO NOT install the tracking code yet!

There are several different ways to install your code. If you rush to put this code on your site right away, you might create extra work for yourself. Completing the beginner steps in this guide will allow you to make an informed decision about how to manage your Google Analytics tracking code.

Identify which users will have access to your analytics account and at what level of access to provide them

It might feel like we are getting ahead of ourselves by talking about account access before we even start tracking your site. But this is the best time to think about account access. Let me explain why.

Don’t lose control of your Google Analytics account!

One of my most popular blog posts is – How To Recover Your Google Analytics Account. This post receives over 1,400 new sessions every month. That’s 1,400 Google Analytics users that are locked out of their account and desperately trying to recover access.

Most of these account owners find out they are locked out when they are in the midst of a marketing effort that requires access to their Google Analytics data. Recovering access to their account may take them two to three weeks. You don’t ever want this to be you. So create a plan to manage your account access from day one!

recover google analytics account

Want more information about account permissions?

Our guide to Google Analytics permissions thoroughly details every level of Google Analytics access. You can review the full guide to gain a complete understanding of account permissions. But I’ve also included the reader’s digest version of what these permission levels are and what they mean below.

Edit Permission

This permission allows users to make substantial changes to your account.  These changes included adding and removing filters, adding and editing goals, deleting views and properties, and much more. I recommend that you only provide this permission level to Google Analytics certified users.

Collaborate Permission

This permission allows users to view reports and also view shared assets like dashboards and annotations within the account.

Read & Analyze Permission

This permission allows users to view reports and perform analysis for any account, property, or view they are assigned.

Manage Users Permission

This permission allows users to provide account access to other users. I recommend limiting this privilege to 2-3 people within your account. It is always a good idea to have at least two people with manage users access, in case one member leaves your organization.

the following people have access to our Google Analytics account

create a preliminary tagging and tracking plan

Tagging refers to installing tracking code on your website that communicates information to Google Analytics.

When you install your Google Analytics tracking code, you are tagging your website with that code. And you’re allowing Google Analytics to measure pageviews on your site. A pageview occurs any time a page on your website loads in a visitor’s browser.

Pageviews are the only website interaction that Google Analytics measures by default.

Moving beyond the Google Analytics default tracking settings

If you want to track e-commerce sales, you have to enable e-commerce tracking.

If you want to track conversions, you have to set up goals.

And if you want to track the things that happen inside your web pages, like video views, page scrolling, downloads, etc., you will need to use event tracking.

Creating a tracking plan that can grow with your website’s needs

Most digital marketers find out that they want to move beyond the Google Analytics default settings at some point in their evolution. By assessing your tagging and tracking needs now, you can limit the amount of upgrading you’ll have to do later on. And you’ll benefit from creating an account that will be set up to track your most valuable data as soon as you’re ready.

Below is a list of some of the advanced Google Analytics tracking features you might want to use. To complete this step, check off any of the tracking categories that are of value to your website analytics. Then identify the pages on your site where you’ll need to put this tracking place.

Keep in mind this is a preliminary plan. You don’t have to be exhaustive and detailed with your tracking inventory at this point. You just want to get a general idea of the type of visitor actions you need to measure to help your site achieve its goals.

List the assets on your website you want to track in Google Analytics:

☐ Key website pages, shopping cart pages, etc.
☐ List file downloads that you would like to track inside Google Analytics. Files like PDFs, apps, etc.
☐ List any on-page events you would like to track. For example, video views, form interactions, button clicks, etc.
☐ Does this site need e-commerce tracking?
☐ List the key conversion points on your website. Thank you pages, account signups, newsletters, lead capture page, etc.

the following pages must be track with google analytics

identify how you will install the google analytics tracking code

It’s time to figure out the best way to install your Google Analytics tracking code. Your answers to steps 4 and 5 of this guide will help make this an easy decision.

There are three primary ways to put Google Analytics on your site.

☐ Manually adding code to your site

Many content management systems will allow you to do this with a code editor that places scripts in your site <head> section.

Google Analytics tracking code

☐ *Preferred* Google Tag Manager (GTM)

Google Tag Manager allows you to add tracking tags for multiple analytics, paid media, and audience measurement tools in one interface. It is our preferred method for putting Google Analytics on your site.

Google tag manager

☐ Plugins for your Content Management system

Most modern content management systems allow you to add Google Analytics with a single click in their interface. Just enter your tracking ID (i.e., UA-XXXXXX-1), and they will handle the rest. This solution is very convenient for beginners but does sacrifice advanced functionality.

Identify how many unique domain names/properties you would like to manage within your accuont

properties in google analytics account

Each website domain or mobile app you want to track = one property. If you want to link multiple domains in one property, you will need to utilize cross-domain tracking to display properly.

☐ Do you need to use cross-domain tracking – yes or no?

Cross-domain tracking is an advanced tracking strategy that allows you to track activities across multiple domains in one Google Analytics property.  You can learn more about how this technique works and if you need to use it by visiting our cross-domain tracking guide.

cross-domain tracking in google tag manger

☐ Write down the domain names you need to track

I track the following domains within this google analytics account

Intermediate level Google Analytics account setup steps

Steps 7 through 17 are designed for Google Analytics users with intermediate level skills. Many of these steps are easy to follow. But if you’re not entirely confident in your Google Analytics skills, you may want to enlist the help of an Analytics certified professional (or become Google Analytics certified yourself).

Identify the KPIs you need to track within Google Analytics

If you want to customize your Google Analytics reports to focus on your most critical success metrics, then you need to know which data points are most important to your objectives. Let’s use some of our example website objectives from Step 1 to define potential KPIs for each objective.

If your objective is pageviews/traffic:

☐ Potential KPIs: Total pageviews, sessions by source/medium, top landing pages, top organic keywords, page value, time on page, goal conversions.

If your objective is e-commerce/sales:

☐ Potential KPIs: Total revenue, e-commerce conversion rate, page value, conversion rate by source/medium, sales by product category, return on ad spend (ROAS), conversion rate by gender/age and interest category, conversion rate by external campaign name.

If your objective is lead generation:

☐ Potential KPIs: Goal conversions, conversions rate by landing page, page value, conversion rate by source/medium, conversion rate by gender/age and interest category, contact form submissions by landing page.

If your objective is affiliate programs/commission based programs:

☐ Potential KPIs: Outbound clicks per landing page, content group conversion rates, page value, traffic by source/medium, top landing pages, top external links clicked by page.

☐ Write down the KPIs that are most important to your website’s objective.

The KPIS I need to track are:

create views to reflect Google Analytics best practices

The purpose of Google Analytics views is to allow you to create different abstractions of your Google Analytics data while protecting the integrity of your analytics data. Views also allow you to control access to reports and improve your reporting capabilities.

Google Analytics views

At a minimum, you should set up the following views for each of your properties:

☐ Main Reporting View

You’ll use your main reporting view 99% of the time you’re in Google Analytics. This view should include filters to block internal website traffic. (Internal traffic is web traffic generated by you, your team, or other people frequenting your website who are not part of your marketing audience). You will also want to block bot traffic from showing up in this view. Make sure your goals and your other vital metrics are configured in this view.

☐ Unfiltered View

This view does not use any filters and doesn’t prevent any data from entering your reporting interface. You’ll use your unfiltered view for diagnosing data discrepancies or anomalies in your main reporting view. This view will also help you troubleshoot data integrity issues.

☐ Test View

This is a view to test filters and new data collection methods before you apply them in your main reporting view. You do not want to obscure your primary reporting view data with experimental filters. So be sure to test your new filters in before you add them to your main reports.

enable the features you need at an account level

There are specific features you need to enable at an account level if you want to take advantage of them.

Google Analytics account settings

Review the following account settings and apply them as needed.

☐ Google Products and services (recommended)

You’ll need to turn on this setting to link to other Google products (like GTM, of Google Ads, etc.) with your account. This setting is also necessary to if you want to enable the Google Search Console.

☐ Benchmarking (recommended)

This setting allows you to use anonymous data to compare your website to other sites in your industry.

☐ Technical support (optional)

You need to enable this feature to allow Google to provide you with technical support.

☐ Account Specialist (optional)

This setting needs to be turned on if you work with a Google Analytics account specialist. Support from account specialist can be critical if you have a Google Ads representative.

Enable your demographics reports (If available in your country)

If you want Google Analytics to collect and report data about the age, gender, or interests of your audience, then you’ll need to enable demographics. You also need to turn on this feature to create remarketing or audience lists in Google Analytics.

Turning on Google Analytics demographics

☐ Enable Demographic and interest reports

Be aware that the Google’s demographics features collect personal data from your website visitors. Although this data is anonymized in your reports, Google still collects this information on your behalf. You may need to update your privacy policy or cookie consent notification to comply with internet privacy laws or GDPR

☐ Adjust your privacy policy accordingly

☐ Adjust your cookie consent policy to comply with GDPR as needed

Which products do you need to link to your google analytics account

Google Analytics is capable of integrating with many other Google products. The advantage of linking your Analytics account with other Google marketing products is that you can see all your data inside Google Analytics. Using analytics to track data from these other platforms can be an ultra-efficient and powerful way to gain deeper insights.

Google Analytics product linking

Check off all the Google products you need to link with your analytics account.

☐Google Ads

☐Google Optimize and Tag Manager

☐Search Console

☐AdSense

☐Ad Exchange

☐BigQuery

☐Display and video 360

☐Campaign Manager

☐Search Ads 360

☐Google Play

☐Postbacks

adjust your data retention setttings

The default data retention setting in Google Analytics is 26 months. In a new account, this may feel like an eternity from now. But time flies when you’re having fun with web analytics! Be aware that if you don’t adjust your data retention setting, Google will dump you user data after 26 months. Without historical user data, you’ll lose many advanced analytics capabilities. If you’re going to want to do historical analysis beyond 26 months, change your data retention setting now.

Data retention controls

Our data retention setting recommendation

We recommend keeping data only as long as needed to perform historical analysis. For some businesses, the default of 26 months is sufficient. For long-term business needs, you may choose a more extended period.

Select a data retention setting:

☐ 14 months
☐ 26 months
☐ 36 months
☐ 50 months
☐ Do not automatically expire

put filters in place

At a minimum, we recommend adding the following filters to your test view and eventually adding them to your main reporting view in Google Analytics.

☐ Bot filtering (Filter known bots in your view settings to exclude all hits from known bots and spiders)

Bot filter Google Analytics

Turning on this filter is as simple as checking a box in your view settings. Google’s built-in bot filter will help you block most known unwanted and spam traffic from your account. But please note that this filter is not guaranteed to block all the junk traffic that enters your reports. So at some point, you may need to create more precise filters to keep your reports clean.

☐ Internal traffic filter (by IP Address or ISP Domain)

Internal traffic filter in Google Analytics

This filter will help you block all website hits from people working at your company, based on their IP address. To block your entire organization (and yourself), you can use a more powerful ISP filter.

create and verify you goals inside of google analytics

After you establish the objectives of your website in Step #1, you can train Google Analytics to recognize when positive actions that occur on your site using goals. You can set up goals based on several user activities on your website, with the most common goal being a destination goal.

Also, note that you will need to put goals in place to see Google Analytics metrics like conversion rate and page value.

Google Analytics setup goals

The available goal types are:

  • Destination (i.e., visiting a key page)
  • Event (i.e., when events are triggered)
  • Pages/screen (when someone views a certain number of pages)
  • Duration (when someone spends a certain amount of time on your site)

You are allowed up to 20 goals (but we recommend 2-3 to get started). What goals do you plan to track in Google Analytics?

I am going to set up the following goals in Google Analytics

create an event tracking plan

In step 4, we created a preliminary tracking plan. If on-page visitor actions (events) are critical to your website objectives, then you want to build an event tacking plan.

Google Analytics event tracking plan

Below is a list of the events that Google Analytics is often used to track. You can use this list to help create your event tracking plan.

☐ Page scrolling

You can use scroll tracking to see how far your visitors read down your pages.

event reports in Google Analytics page scrolling

☐Videos

You can use video tracking to see how often, and how much of your videos your visitors view.

☐ Downloads

You can use link click tracking to record event data in Google Analytics when visitors access your downloadable content.

☐ Form tracking

You can use form tracking to record when your visitors fill out or submit information in your lead generation or contact forms.

Event reports in Google, form tracking

☐ Outbound link tracking

You can use link click tracking to track clicks on outbound links from your site.

Don't see an event listed? Define additional events here. The following events need to be set up in Google Analytics

setup campaign tracking

If you want to track your efforts to drive traffic to your website in Google Analytics, you need to use campaign tracking. We recently published a full campaign tracking guide and checklist. This guide will help you set up, track, and evaluate the results from your email, PPC, and referral traffic using Google Analytics.

Google Analytics campaign reports

☐ Add UTM codes to your email, PPC, social media, and referral links so that you can track all your outbound marketing efforts in Google Analytics. (Use our full campaign tracking guide and checklist).

☐ Enable auto-tagging for your campaigns if you’re using Google Ads

auto tagging google ads campaigns

verify your tracking code is firing properly

You need test and verify any advanced tracking that isn’t part of the Google Analytics default settings. If you use GTM to execute your event tracking plan, you can test your tags right inside of GTM.

If you manually code or have a developer install your event or conversion tracking, you need to test your custom tags. You can use the chrome extensions Tag Assistant and Google Analytics Debugger to check your tracking scripts.

Testing tag with Google Tag Assistant

☐ Install the Google Tag Assistant browser extension for Chrome
☐ Check that tags are firing with no errors
☐ Advanced: If you do not see the results you expect, install and run the Google Analytics Debugger Chrome extension

Google Analytics Debugger

advanced level google analytics account setup steps

These tasks represent an advanced understanding of Google Analytics. It is highly recommended that only Google Analytics certified individuals perform these tasks. (Not there yet? Get certified in less than 30 days with our Analytics Course).

map your e-commerce tracking plan

Tracking sales and revenue is critical for just about every company selling products online. Using e-commerce tracking in Google Analytics can take your online sales analysis to a whole other level. When you track your sales and revenue data in Google Analytics, you can add demographics data, page level traffic data, and event data to your sales numbers.

This level of analysis can help you isolate the characteristics of the customers coming to your website. You can see how your customers are finding your site. And you can figure out which type of site content leads to conversion so that you can increase your sales.

E-commerce tracking installation options

Like many of the other advanced tracking features, setting up e-commerce tracking can be simple or complicated depending on the options you have available. Many content e-commerce platforms offer plugins that can connect your site Google’s standard and enhanced e-commerce tracking systems.

Google Analytics ecommerce reports

If you’re setting up e-commerce tracking manually (without using a plug-in), here are the steps you need to follow:

☐ My company is using Google Analytics to track an e-commerce website
☐ Enable e-commerce in a view that will be tracking transactions
☐ Implement the e-commerce tracking code for standard e-commerce websites and verify it is collecting data correctly
☐ Enable enhanced e-commerce in a view requiring enhanced e-commerce functionality
☐ Map out all actions to be tracked by enhanced e-commerce
☐ Implement enhanced e-commerce code on your website and verify it is collecting data correctly

create an automated reporting dashboard in Google Analytics or Google Data Studio to track you most critical KPIs

What’s the most critical part of working towards a goal? Tracking your progress towards achieving your goal! And the best way to monitor your progress is to keep your KPIs front and center.

Back in step #7, you defined your website’s KPIs. Now it’s to make those metrics readily accessible so that you don’t have to dig through your analytics reports every time you want to know how you are doing.

Google Analytics Dashboards

Campaign tracking dashboard

Google Analytics allows you to build custom dashboards that include the charts and graphs you need to see most often. You can even import and edit dashboards that other users have created from the Google Analytics Solution Gallery.

Google Data Studio Dashboards

Adding metrics to our SEO Dashboard

Or if you’re serious about your reporting dashboards (like I am), you can connect your Analytics account to Google Data Studio (GDS). Data Studio has a cleaner reporting interface and is more flexible than working inside Google Analytics. You can connect directly to the Google Analytics API using GDS. To see an example of how to create a GDS dashboard for your KPIs, check out our guide on building a custom dashboard for SEO reporting.

☐ Import or create a custom dashboard in Google Analytics to track your most important KPIs using the Google Analytics Gallery

Or

☐ Connect your Google Analytics account to Google Data Studio to create a more advanced dashboard

set up custom content groupings as needed

Content groupings allow you to categorize your web pages by product, topic, or other page level characteristics. You can use content groupings to get a holistic view of how your website’s content is performing.

Content grouping reports

☐ Use the steps in our content grouping guide and checklist to set up this feature in your account.

Channel groupings work similar to content groupings. They are often used with different reports from content groupings. And because channel groupings don’t use your site’s code, they can be applied retroactively.

creating custom Channel grouping in google analytics

☐ Use the steps in our channel grouping guide to set up this feature in your account.

build advanced segments to keep track of KPIs as needed

Advanced segments are like the analyst’s version of a butcher knife. Using advanced segments, you can carve through your analytics data and pull out the juiciest parts.

You can build advanced segments to create customer avatars, audience cohorts and much more!

Google Analytics advanced segments

☐ Create advanced segments for key visitor segments.

link your google analytics account with other google products

In step #10, we identified other Google marketing products you want to use. Now that your account is in working order, it’s time to connect those products to Google Analytics.  You can connect to your other Google products in your property settings.

Connecting your Analytics account to your other Google marketing platforms will help maximize the effectiveness of Google Analytics.

Product linking in Google Analytics

Check off all the Google products you have successfully linked with your Analytics account.

☐ Google Ads
☐ Google Optimize and Tag Manager
☐ Search Console
☐ AdSense
☐ Ad Exchange
☐ BigQuery
☐ Display and video 360
☐ Campaign Manager
☐ Search Ads 360
☐ Google Play
☐ Postbacks

utilize custom dimensions and metrics in Google Analytics

To make your analysis more effective, create and populate custom dimensions and metrics in Google Analytics. These customizations make analysis easier. They also allow you to bring external data into your reports and make Google Analytics speak the language of your business. Each property can have 20 custom dimensions and 20 custom metrics.

custom dimension in Google Analytics

☐ Plot your custom dimensions and metrics
☐ Decide scope of each dimension and metric (product, hit, session, user)
☐ Define custom dimensions/metrics inside Google Analytics property settings
☐ Tag your site to populate these custom values for each visitor

create an experiment with google optimize

Google Optimize is an A/B split testing system within Google Analytics. If you want to improve your conversion rates, consider running an experiment with Google Optimize.

Google optimize

☐ Create and launch your first experiment
☐ Plot the areas that could use improvement
☐ Create a test plan for what can be improved, and how
☐ Add the experiment into Google Optimize
☐ Conduct experiment and review results

[ddownload id=”26561″]

Did you complete all 25 steps?

That’s our complete guide to building and optimizing your Google Analytics account. If you’ve worked through all 25 of the steps in this checklist, then you are a true Google Analytics hero!

Leave a comment with your questions

Do you have questions about any the steps in this guide? If you do, leave a comment below. Or check out our Google Analytics, Tag Manager, and Google Ads training programs.

Filed Under: Analytics Resources, Google Analytics

How To Measure Your Content Using Page Value – Not Bounce Rate!

April 11, 2018 by Jeff Sauer 2 Comments

How do you measure the performance of your web pages in Google Analytics?

Google Analytics gives us all sort ways to evaluate our websites.  Usually, when we want to look at the monetary value of our website, we look at conversions.

But Google Analytics doesn’t show us conversions at a page level.

To figure out the value of your content (your pages, posts, or product listing) you have to use a different metric.

One of my favorite metrics! – Page Value.

Page Value is how you measure the monetary performance of your web pages in Google Analytics.

In this post, we are going to do a full tutorial on Page Value. I’ll also show you why you should focus on Page Value, and stop looking at bounce rate!

If you want to get better at measuring the dollar value of your website content, then follow along with this video and post.

Why can’t I see the conversion rate for my pages?

If you look at your Site Content reports in Google Analytics, you’ll see all sorts of metrics. You can look at pageviews, bounce rate, exits %, etc.

But, (except in the landing page report) you can’t see conversion rate. That’s weird, right? All this emphasis on content, but no conversion rate!

The reason you can’t see conversions in your All Pages report has to do with the scope of the metrics.

Conversions are a session related metric, not a pageview related metric.

In Google Analytics, pageviews are the action taken by a user to load a page in their browser. Users are unique devices (more accurately, cookies) that access your website.

And sessions represent all the activity a user performs on your website during a 30-minute window of time.

A user can reach a goal (convert) once, or more than once, during a session. The user’s conversion is not associated with any one unique pageview, aside from the first page they visit – their landing page.

Landing Page conversion rates

The landing page is the first page of your visitor’s session. Simply put, a landing page is the entry point on your site for a user’s session. Every session has one landing page hit. So landing pages are a session related dimension. And they can have a conversion rate.

Let’s take a quick look at the Landing Pages report.

In the Landing Page report below, you can see the e-commerce conversion rate for each landing page.

Like we discussed, each session has a landing page. And the landing page dimensions work with the conversion metrics in your reports.

If you want to learn more about landing pages, you can read our full tutorial on the Landing Page report – How to Maximize the Google Analytics Landing Page Report.

The bottom line is that you can see page level conversions on the Landing Page report, but not in the All Pages report.

For standard page views, we don’t have any conversion metrics. Instead, we have Page Value. The Page Value metric is designed to help answer the question –“How much is a web page worth?”

What is Page Value?

But what is Page Value? How is it defined and how is it calculated?

Let’s start with Google’s definition of Page Value:

The average value of this page or set of pages. Page Value is ((Transaction Revenue + Total Goal Value) divided by Unique Pageviews for the page or set of pages))

Google’s explanation is a good one. But it’s a bit complicated. Words are not always the best way to understand an equation.

Google also offers us this a graphic to help us better understand how to calculate Page Value.

Page Value in Google Analytics
Source: Google

In this depiction, there’s one unique pageview, a goal conversion worth $10, and transaction that’s worth $100.

So, the page value assigned is equal to $110.

The calculation is:

(Revenue + Goals) ÷ Pageviews = Page Vale

If you had multiple page views associated with a goal and purchase, your page value calculation might look like this:

(Revenue $100 + Goal $10)/ 5 pageviews = $22.00 Page value.

In this scenario, every page associated with the goal and purchase is assigned a $22.00 value.

Page Value distributes equal value across all the pageviews that lead to a conversion. It’s not perfect – but it’s straightforward, and it works.

Here are some things to keep in mind when looking at your Page Value

1. Page Value is always higher for cart pages

As you can see below in the Google Merchandise Store account, the Page Values are much higher for the cart pages.

There are a couple of obvious reasons why cart pages have a higher value. Cart pages are almost always associated with a conversion. A visitor on a shopping cart page is more likely to result in a conversion being reached than someone reading a blog post.

Also, some of your cart pages must be associated with every transaction. So those pages will accrue a higher value than your other page since every conversion runs through them.

2. If your Page Value is $0 across the board, you need goals

Without Goals, you won’t have useful page values. So set up your Goals!

If you need help figuring out how to set up Goals check out these tutorials:

Google Analytics Conversion Tracking and Retroactive Goals

How do you Choose a Google Analytics Goal Value?

And… Sign up for Analytics Course. Goals are a super important part of Google Analytics! In Analytics Course, we will help you understand Goal Funnels, Goal tracking, e-commerce conversions, etc.

3. If individual pages have low value, UPGRADE THEM

One way to improve a low-value page is to offer a content upgrade. Using lead magnets or email opt-ins can help you increase the value of your most popular content.

You can check out my full tutorial on creating content upgrades here – Content Upgrades and Lead Magnets: How to Create and Deploy.

Page Value is an easy self-test

If you see an exorbitantly high Page Value, either something you’re doing is working or you are looking at false positive.  Remember, your cart pages will naturally have an inflated value.

Pages that have low value represent a chance to make improvements. Your content on low-value pages may not be optimized. Or you may not have enabled any goals associated with the content on your pages.

Page Value is a great way to understand the performance of your content. It’s also a reminder to put goals in place, and give your visitors a chance to convert on your best content.

And Page Value is much better metric than Bounce Rate!! To learn more about why bounce rate is a useless metric, check out this great article by my friends at ThinkSEM. You might see a few more of my critical thoughts about bounce rate in this post.

To summarize, Bounce Rate sucks!

Look at Page Value to assess the performance of your content instead of bounce rate.

What do you think of Page Value?

Do you use Page Value in Google Analytics? Page Value is a great way to figure out how much your content is worth to your marketing. But, even though this metric is pretty straightforward, it can still be confusing. Leave a comment below with your questions or thoughts about Page Value.


This post and video was episode 81 in our 90 Day Challenge digital marketing series.

To get access to all 90 videos, subscribe to our YouTube channel. YouTube will send our subscribers weekly emails about all the videos we published over the past week.

Want to know about each video and post as soon as it comes out? Sign up for the 90-day challenge email newsletter. The newsletter will be the best way to make sure you don’t miss any of the content.

Filed Under: Google Analytics

Troubleshooting the Google Analytics Demographics Reports

April 4, 2018 by Jeff Sauer 5 Comments

Google Analytics demographics reports provide powerful information about your website visitors.

These reports can show you data about your audiences’

  • Age,
  • Gender,
  • Interests,
  • And buying preferences.

This demographic information can help you answer one of the most critical marketing questions:

“Who is my customer, and what do they want?”

The demographics reports are supposed to be easy to set up.

But lately, many Google Analytics users have experienced problems enabling these reports. And these problems have caused a lot of confusion about how to access demographics data.

Google hasn’t provided any extra guidance for users experiencing problems. So we’ve had to take our troubleshooting measures into our own hands.

In today’s post, we’ll take a look at the data available in the Google Analytics demographics reports. We’ll walk through how to setup your demographics reports. And, we’ll look at how to troubleshoot problems accessing this data.

Google Analytics demographics reports

The demographic reports are an excellent resource for learning more about your website visitors.

These reports allow you to access data about the age and gender of your audience.

Google Analytics demographic char

You can also segment your visitors based on their demographics. Segmentation can help you profile your highest converting customers.

You can create segments based age, gender or other characteristics.

Google Analytics demographic report

And you can use in-market segments to find out what your visitors are most interested in buying.

Google Analytics demographic report

Adding demographics information to the data you normally collect is an excellent enhancement to your Google Analytics data. Especially, if you’re using this data to inform your paid advertising.

Having this data in your analytics account is like getting toppings on your ice cream. When this feature works, it takes something that is already good – and makes it even better!

But what about when it doesn’t work? Google tells you that setting up demographics reporting is as simple as clicking a button. However, in my experience, this process takes some additional configuration.

One of our Analytics Course students had the same problem. Together, we worked through the steps to unlock her demographics data.

Analytics Course Student question

Denise was trying to get access to her demographics data, and it wasn’t working.

So she sent us the following question:

I have been having a problem for a while now. I have had google analytics up and running for over 2 years and have all of the data we have talked about EXCEPT demographics.

And I have tried everything I can think of, as a beginner, clicked on the link GA provided and made the changes they suggested. Just today, found an alert that suggested I turn on Enabling Advertising features (hopefully this works).

This data is critical to what I need to know about my target market. Do you have any ideas?

Here are the steps we used to troubleshoot her problem.

Troubleshooting Google Analytics Demographics

To access your demographics data in Google Analytics, you need to take the following steps:

1. Enable demographics reporting in the interface

At a minimum, you need to go into your web property settings and – “Enable Demographics and Interest Reports”

enabling Google Analytics advertising features

If you want more guidance on this step, you can click the learn more link under the Advertising Features button. But, Google’s support documentation on setting up your demographics data is pretty limited. Basically, it says, if you click the button, these features will work.

Google's demographic report support documentation

In my experience, there a couple more steps you need to take to ensure your setup works.

2. Adjust your code to start using display features (optional?)

Google says adjusting your code is optional. But I’ve found this is the step that makes the difference if you’re demographics data is not working.

You need to add the text that’s highlighted below –  ga(‘require’,’displayfeatures’); – to your Google Analytics tracking code.

Google analytics demographic data code

You can also adjust your code using Google Tag Manager (GTM). To complete this step in GTM, all you need to do is enable Display Advertising Features.

using Google tag manager to troubleshoot demographic reports

This step is always part my process for enabling my demographics reports. And every time I use GTM to set this up, my reports work.

So, although Google says this step is optional, it’s not optional for me. I’d rather not risk losing access to this data.

3. Update your privacy policy to make sure you’re in compliance

Make sure that your privacy policy discloses the data you are collecting in Google Analytics.

Google provides a lot of documentation about how you can use their Advertising Features.  I recommend that you read this information and think about how it affects your privacy policy.

Google Analytics advertising features support
https://support.google.com/analytics/answer/2700409?hl=en

Google Analytics advertising features support

Each country has different rules and regulations about privacy policies. And with GDPR coming soon, these reports may be removed from certain countries if they haven’t been already. Get to know how the privacy regulations work in your area, and make sure you comply.

Is one extra step all it takes to fix the Google Analytics demographics reports?

Now, here’s the question I have: Is one extra step all it takes to get the demographics features to work?

Google says that step two in our process is optional. But, in my experience, this is the step that fixes any problems accessing demographics data.

So why is this step optional?

We are in transition phase when it comes to collecting this type of data. And collecting this information isn’t going to get any easier post GDPR environment.

Overall, my recommendation is to play it safe with this data collection and enable every option at your disposal. This means adding “optional” elements in addition to clicking buttons within the Google Analytics interface. It’s better to overdo it, and be redundant, than to lose access to valuable data.

Also, make sure you’re very explicit with the data you collect. And follow the privacy rules in your jurisdiction.

When you’re trying to troubleshoot these problems, remember, Google’s documentation and recommendations are not always up to date. Sometimes changes are occurring behind the scenes, and their documentation websites are not updated.

Are your demographics reports working?

The one-click demographics setup doesn’t work for many users, even though Google says it should. This has been causing problems and confusion for a lot of users.

So I would love to know… How has this process worked for you? Are you able to get your demographics data using the one-click setup ? Or have you had use GTM or adjust your code? Leave a comment below about your experience with the Google Analytics demographics reports.


This post and video was episode 74 in our 90 Day Challenge digital marketing series.

To get access to all 90 videos, subscribe to our YouTube channel. YouTube will send our subscribers weekly emails about all the videos we published over the past week.

Want to know about each video and post as soon as it comes out? Sign up for 90 day challenge email newsletter. The newsletter will be the best way to make sure you don’t miss any of the content.

Filed Under: Google Analytics

How to Identify and Remove Bot Traffic in Google Analytics

March 28, 2018 by Jeff Sauer 6 Comments

Let’s talk about bot traffic in Google Analytics.

Most of the time, bot traffic in our analytics data gets a bad name. We think of it as spam, and we don’t want this data anywhere near our reports.

Sure, there are spam bots sending hits to our analytics data. But there are also good bots. Or at least bots that we want to visit our websites, for testing, diagnostics, and even monitoring SEO results.

Whether or not you welcome this bot traffic, 99% of the time you don’t want to see bot traffic in your analytics reports.

Why? Because Bots are not real users, and they don’t perform like humans. Heavy bot traffic (5% of sessions or more) can skew our data and pollute our analytics.

How do you keep the bots out of your Google Analytics reports?

Google doesn’t always block the bot

I love Google Analytics… But sometimes their “one size fits all” tool misses the mark.

Now, I’ve been pretty outspoken about how Google handles spam traffic. And for a long time, my take was that Google wasn’t doing much to keep the spam traffic out of our analytics reports.

Is Google Analytics Newest Data Quality Issue the Most Challenging

Google was like Fredo in the Godfather II when it came to defending our data against spam – drastically underachieving!

You broke my heart google

And the community noticed. Like many Google Analytics users, I started checking out other analytics products. Maybe the grass was greener somewhere else?

Is Google Analytics the best analytics software?

When users started threatening to move away from Google Analytics, Google took notice. And since then things have gotten better. There’s been a noticeable reduction of spam traffic in our analytics reports.

But, spam is just one type of bot traffic that can pollute our analytics data. Many varieties bots hit our websites, and sometimes we are the ones sending bots to our sites.

How do we keep the Bots out?

Defending your data against bot traffic is a bit like playing whack-a-mole.

You have to identify the unwanted website hits and respond.

Let’s look at how we can identify bot traffic. And let’s walk through some strategies for blocking this traffic from our analytics reports.

Analytics Course Student Question

One of our Analytics Course students recently noticed a big issue with bot traffic in his reports. And he wants to know how to respond to the problem.

Keith Asks:

We recently sent an email blast out using an email list that we rented. The company is well known with a good reputation as far as we can tell. We received clicks to the site but no action once on the website and looking through GA I see that 82% of the clicks can be located to the United States but is (not set) for state, city & metro. I have not seen such a high number of (not set), in fact we on another site we have we had 300 not set in the last 250,000 sessions.

The email was targeted at Seattle and the Network/Service Provider dimension shows Microsoft Corporation. Looking at a number of other sites we manage, we don’t have anywhere near the % of location (not set), even for Network/Service Provider: Microsoft Corporation.

So what do you think. Is this a case of a narrow target to Seattle for a number of individuals at Microsoft that happen to block geo location or perhaps something fishy with bot clicks from the email list provider to show results? (no accusations, just haven’t seen numbers like this

Here’s Keith problem: His company sent out a targeted email campaign, and it resulted in a bunch of unwanted hits in their Google Analytics reports. This happens from time to time.

But then something interesting happened. The geo-location for the majority of this traffic was “(not set).”  And all the not set traffic is coming from one ISP organization – Microsoft Corporation.

Keith wants to know if this bot traffic?

It is most likely bot traffic

Here’ why: Keith is getting a disproportionate amount of location (not set) data in his reports. Also, the traffic doesn’t sound like it exhibits human behavior. It’s doubtful that Microsoft employs a bunch people to sit around and click email links, and then immediately bounce off his site once they click through.

So how do we keep this traffic out of our reports?

The Google black-box solution

The easiest way to keep bot traffic out of your Analytics reports is to use Google’s automatic filter. To set up this filter, go to your view settings and check the box that says “Exclude all hits from known bots and spiders.”

Google's bot traffic filter

I’ve used Google’s auto filter on almost every account I’ve analyzed.

And I’d say 60% of the time; it works all the time.

The bot traffic filter in Google Analytics work 60% of the time, every time.

When this filter doesn’t work, two things could be happening.

False positives and false negatives.

Google’s black-box doesn’t always exclude the traffic you want to exclude. And it doesn’t always include the traffic you want to include.

So, you have to run tests. You want to be proactive with testing your filters, and not trusting Google blindly.

Why? Because you can’t remove bot traffic from your analytics data after the fact. So you want to put filters in place before this traffic becomes pervasive in your reports.

Here’s how to set up bot filters in Google Analytics

Step #1 – Create a new Google Analytics View

When you create a view to test bot traffic, give your view a very specific name. That way other users in your account will know the view is only for testing bot filters. Google organizes views alphabetically.  If you start the name of your view with “XX,” it should show up at the bottom of the view list, and most users won’t see it in your account.

bot traffic filter

Step #2 – Uncheck your bot setting

In your new view, uncheck your bot filter. You want to let the bot traffic into this view.

Step #3 – Understand your bot traffic

In the example below I’ve tried to replicate Keith’s problem.

If you look at the traffic coming from “Microsoft corp,” you can see the average session duration is 2 seconds. The other behavior metrics are also different from the rest of the traffic.

identifying bot traffic

The lousy traffic doesn’t have all the bot qualities we usually see. Bot traffic typically has a 100% bounce and 1 page per session.

But it still looks like junk to me. So, I am calling it a bot!

Step #4 – Develop a filter pattern

In this case, we’ll create a filter excluding traffic by ISP Organization.

excluding bot traffic

Step #5 – Verify your filter

In your filter settings, use the “filter verification” to run a test.

Our verification test indicates that our filter should be useful.

bot traffic filter verification

Step #6 – See if it worked

You’ll have to check your reports to see if your filter worked. It may take a little a while to find out if you blocked the bot traffic. Be patient! You should know after a couple of days if your filter has removed the junk traffic from your reports.

be patient when checking your bot traffic filters

If your filter was successful, you could add it to your main view. If it didn’t work? Try adjusting your exclusions again.

The waiting game is part of the life of an analyst. You’re often waiting for the data to come in so that you can review results.

It’s part of the cycle of reviewing your data quality.

the data quality review cycle

The cycle works like this:

  • You analyze the traffic in your reports
  • Then you identify anomalies in your traffic.
  • You determine the cause of those anomalies.
  • Next, you implement a fix for these problems.
  • Then, you document the flaws, using annotations or other records
  • And you analyze your traffic again – a day, a week, a month later, to make sure your solutions are working.

Hopefully, you can apply this method to your future data quality analysis.

Filtering bot traffic: Questions or comments

We did our best to be thorough in explaining how to filter bot traffic from Google Analytics, but every situation is different. So let us know how we can help.

Do you have questions about identifying or excluding bot traffic? Leave a comment below, and I’ll answer any questions you have.


This post and video was episode 67 in our 90 Day Challenge digital marketing series.

To get access to all 90 videos, subscribe to our YouTube channel. YouTube will send our subscribers weekly emails about all the videos we published over the past week.

Want to know about each video and post as soon as it comes out? Sign up for the 90-day challenge email newsletter. The newsletter will be the best way to make sure you don’t miss any of the content.

Filed Under: Google Analytics

  • Page 1
  • Page 2
  • Page 3
  • Go to Next Page »

Primary Sidebar

Latest Blog Posts

  • How to use Google Signals and the Cross Device Tracking Reports
  • Google Analytics Tagging Guide and Checklist
  • The Complete Google Analytics Account Setup Guide
  • How To Measure Your Content Using Page Value – Not Bounce Rate!
  • Troubleshooting the Google Analytics Demographics Reports

Copyright © 2006 - 2023 · Digital Mantis, Inc.